Converting data to JSON format
Alright, let's say you've tracked down data and you've cleaned it up.
You want to turn it into some cool data visualizations from scratch, however, first you need to turn it into a format that the can be interpreted correctly.
If you're building a viz from scratch with Javascript that usually means you have to turn the data you have on a spreadsheet into JSON.
JSON is Javascript Object Notation and is just a format of structuring data so it can be parsed by Javascript.
A couple online converters
The two links above are usually all you'll need.
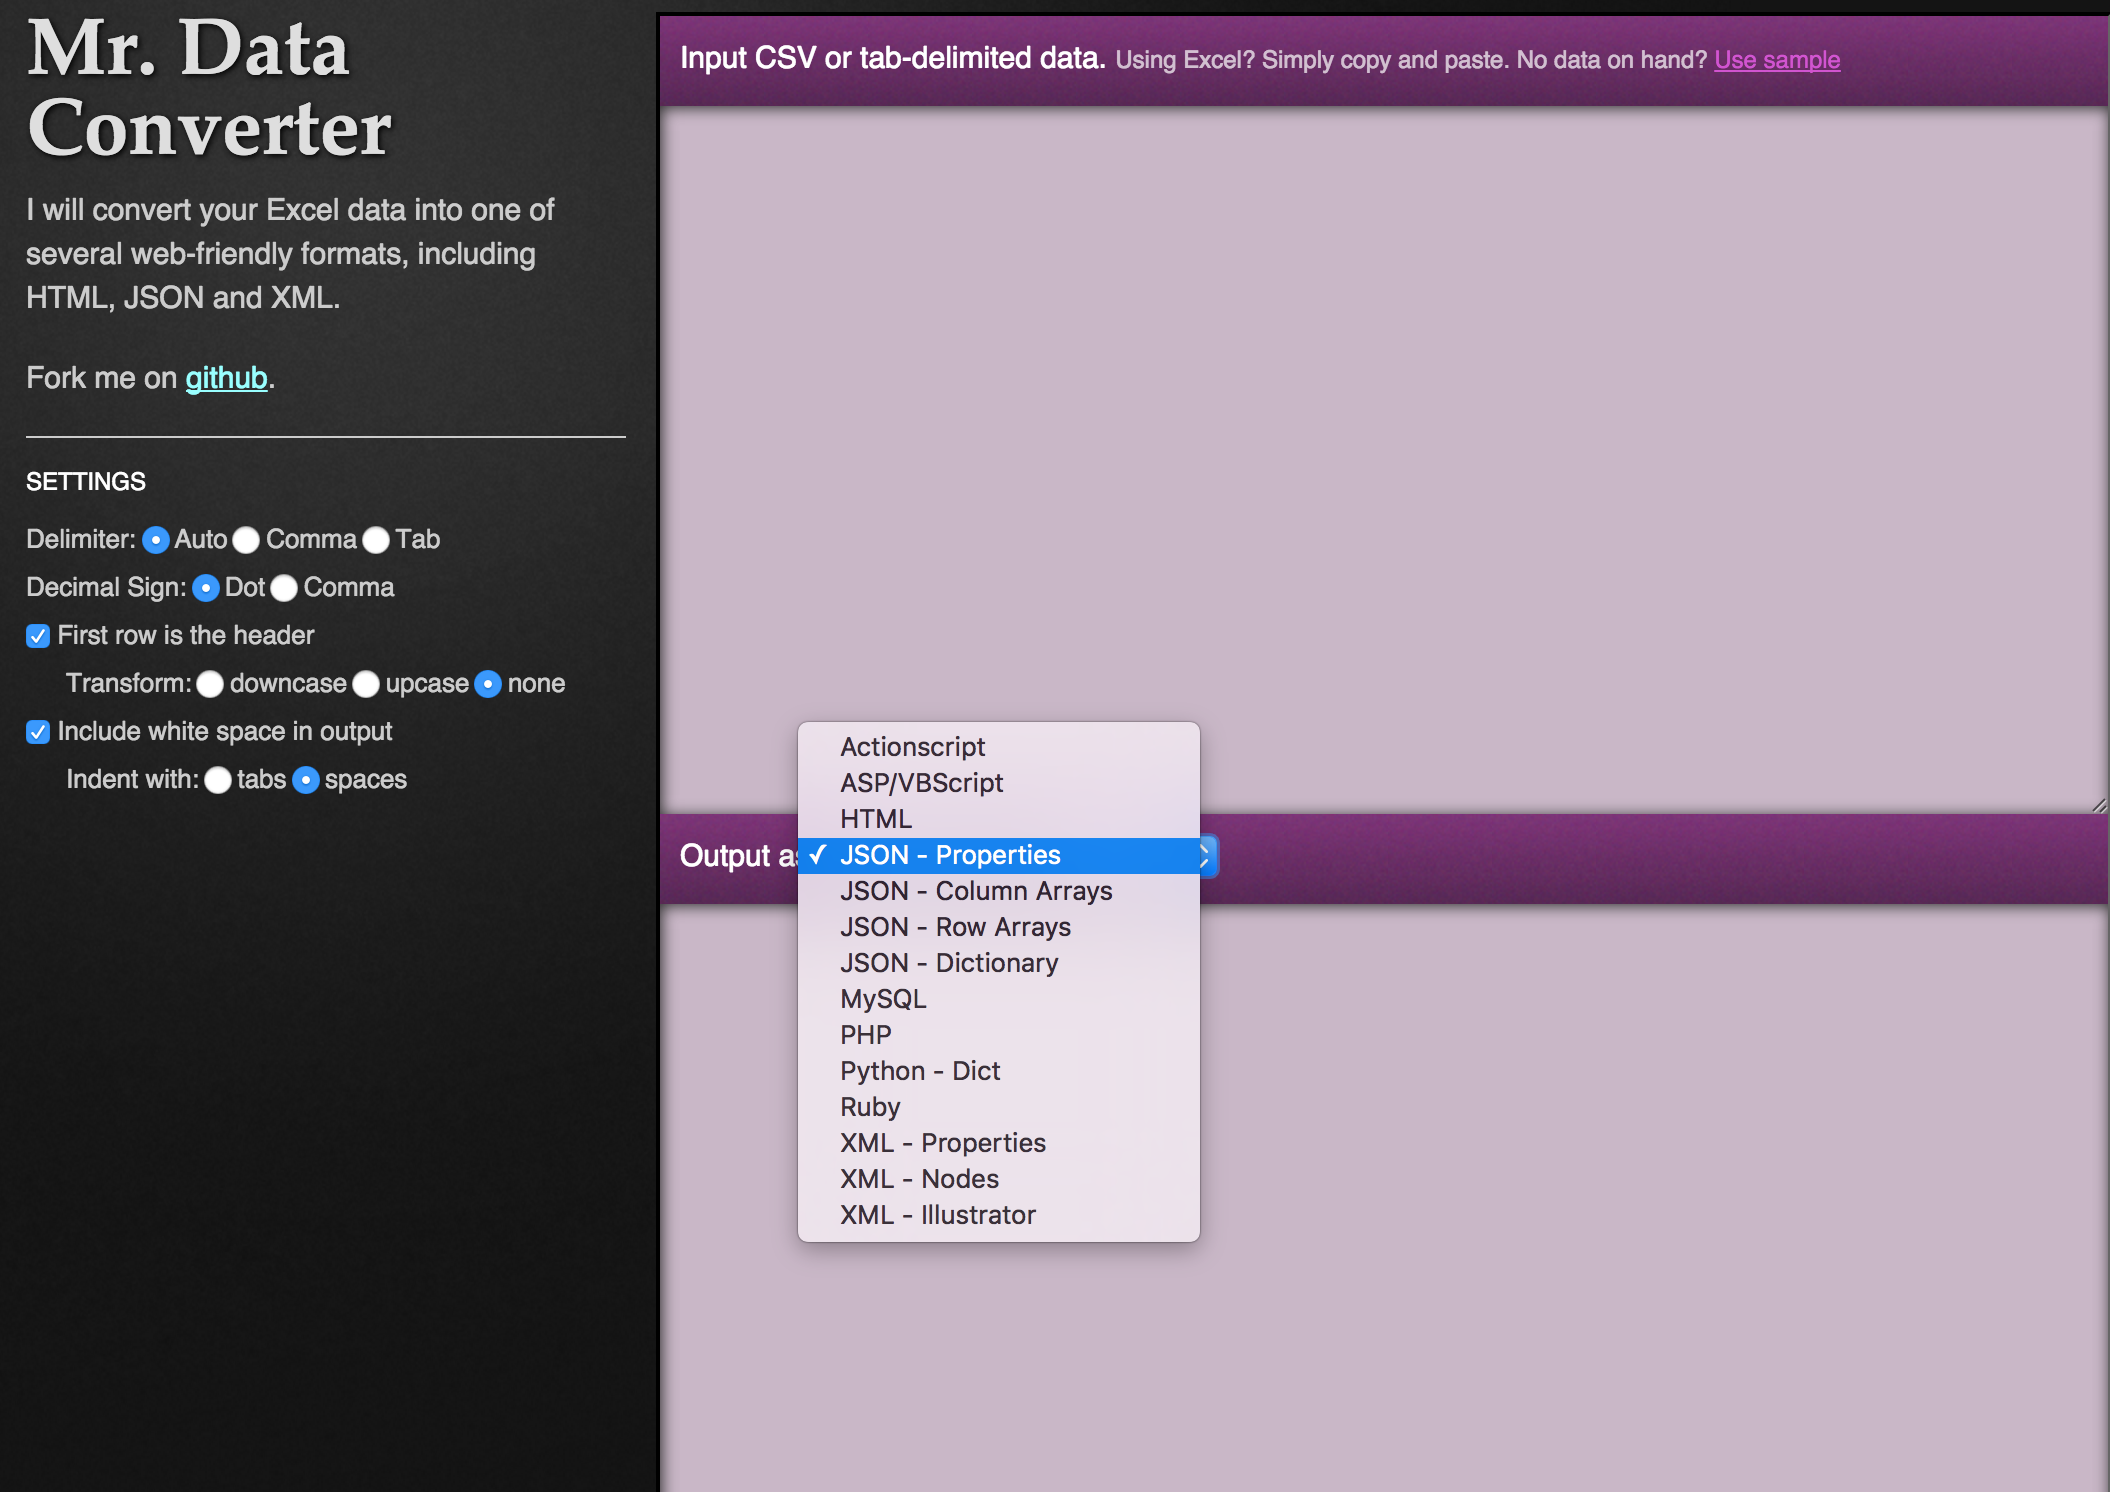
Mr. Data Converter in particular is nice because it has a pulldown menu with many JSON Output options.
But sometimes you need to turn the data into something more complicated.
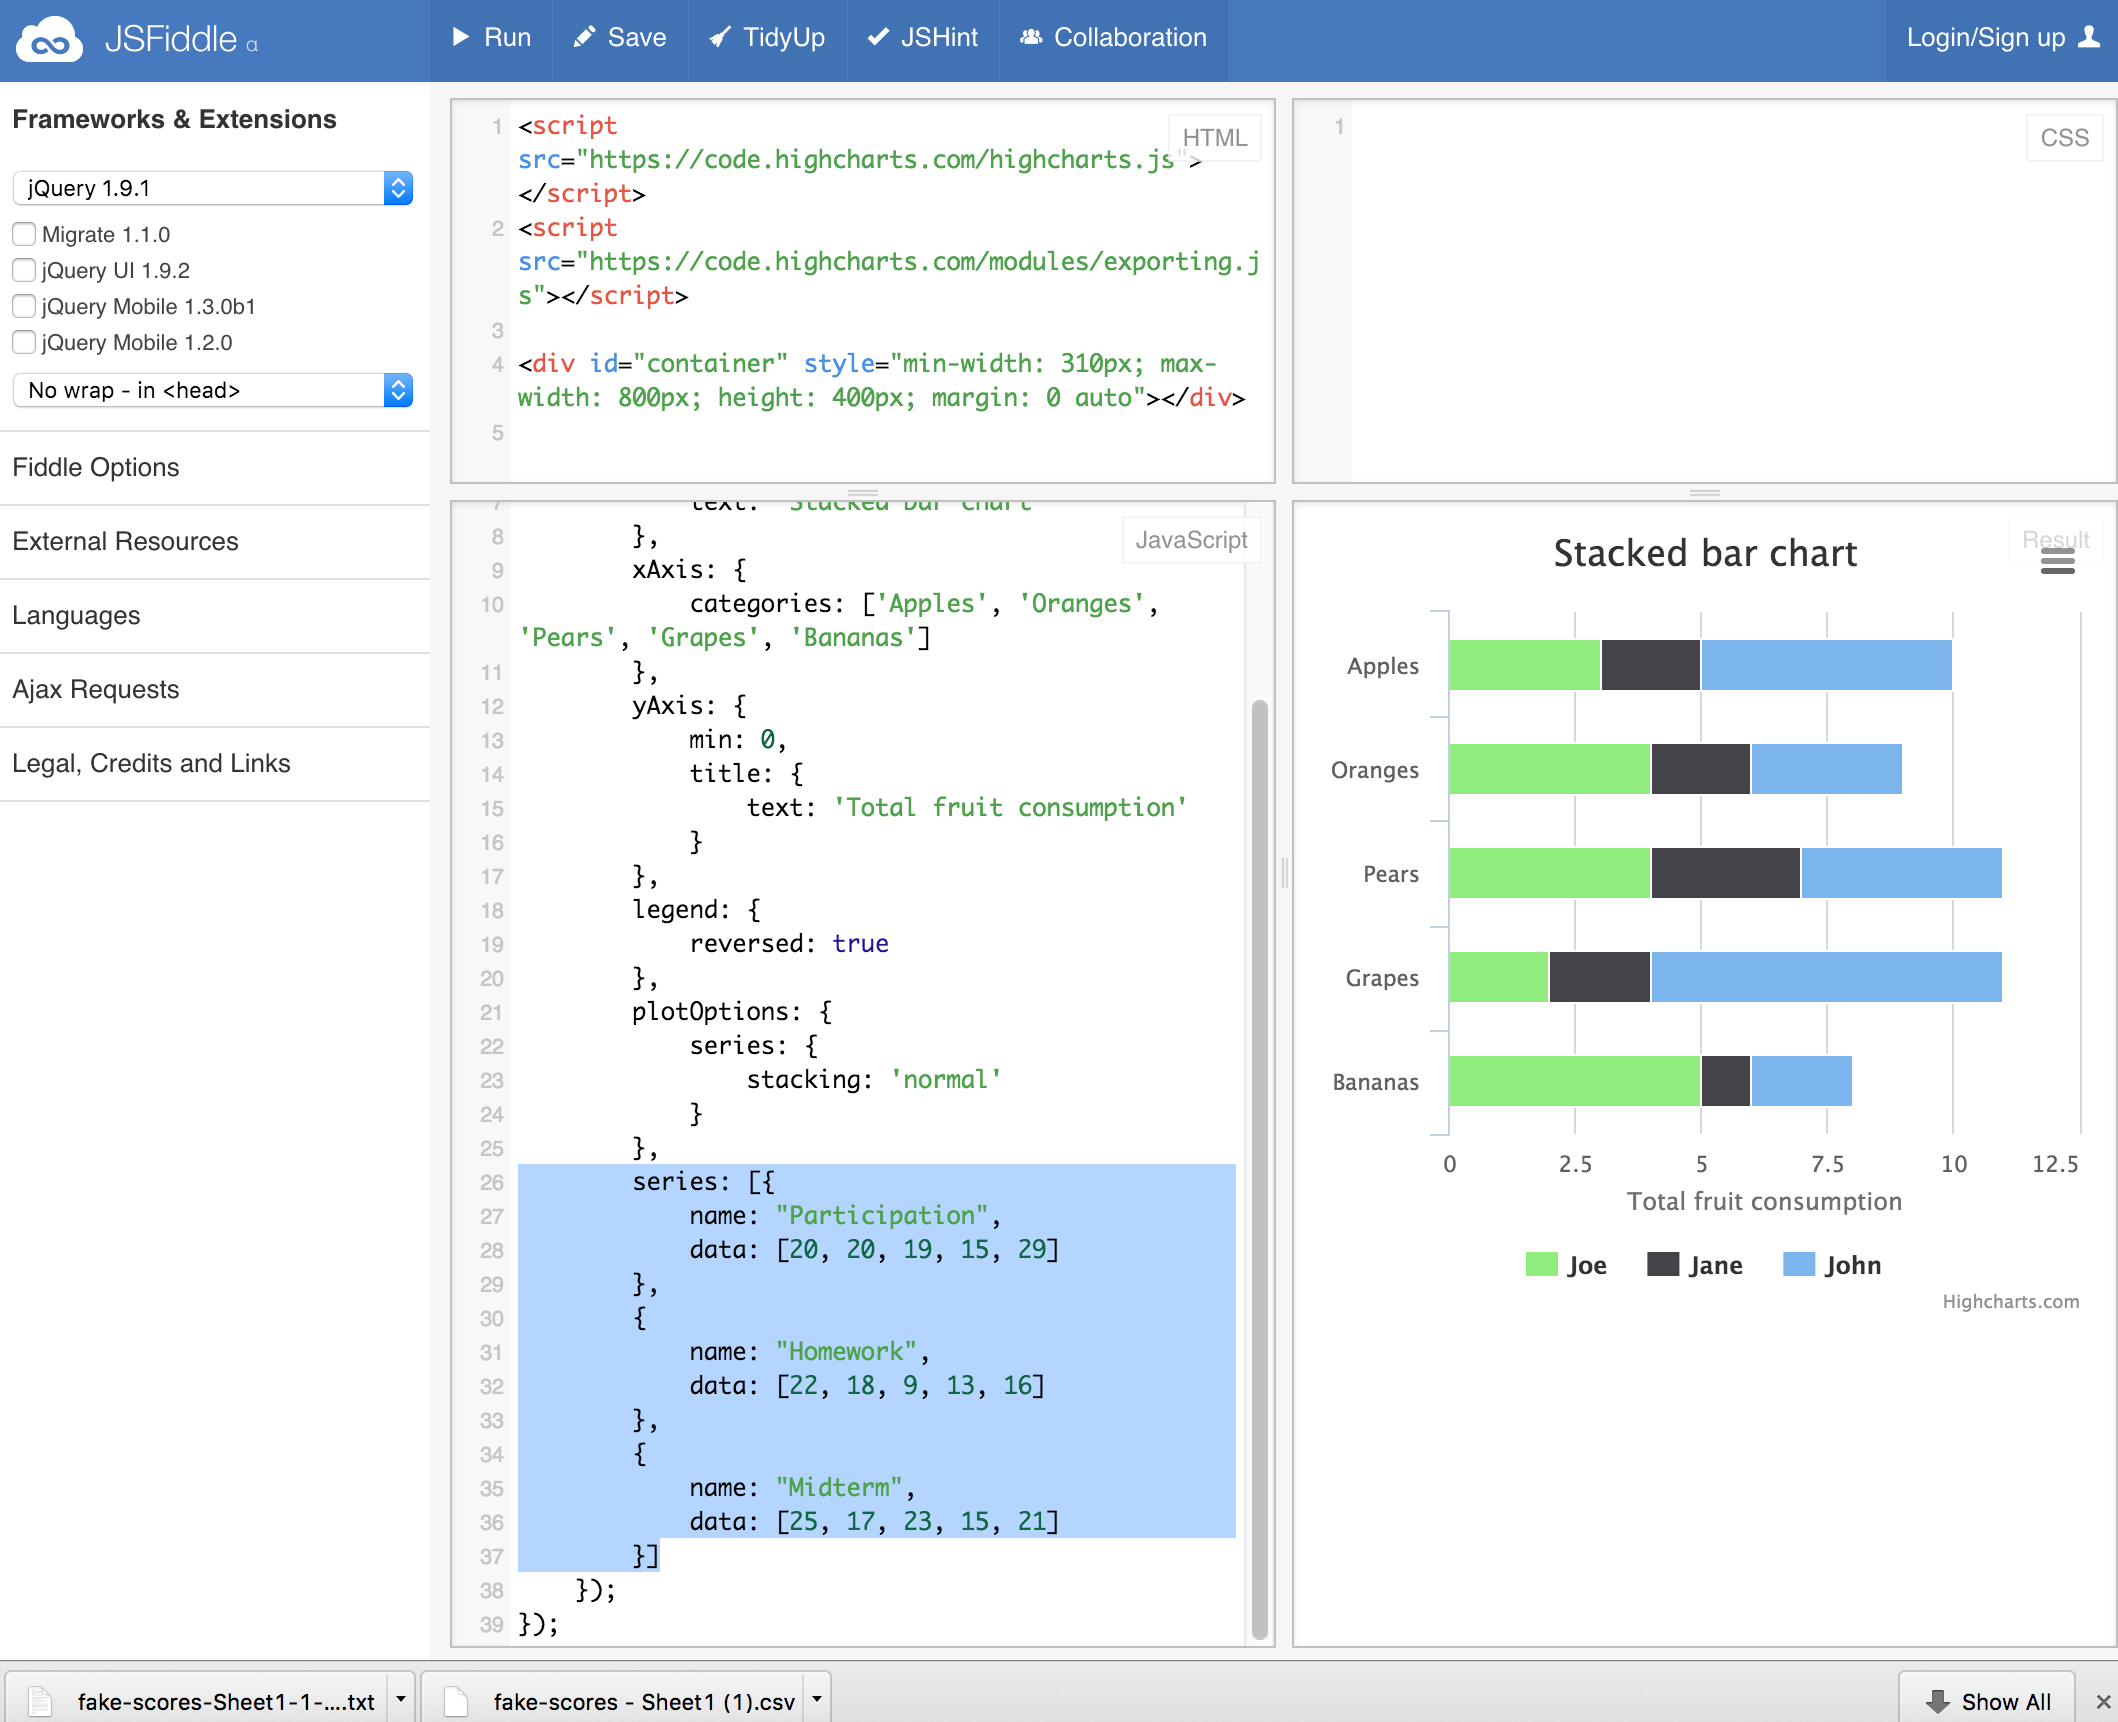
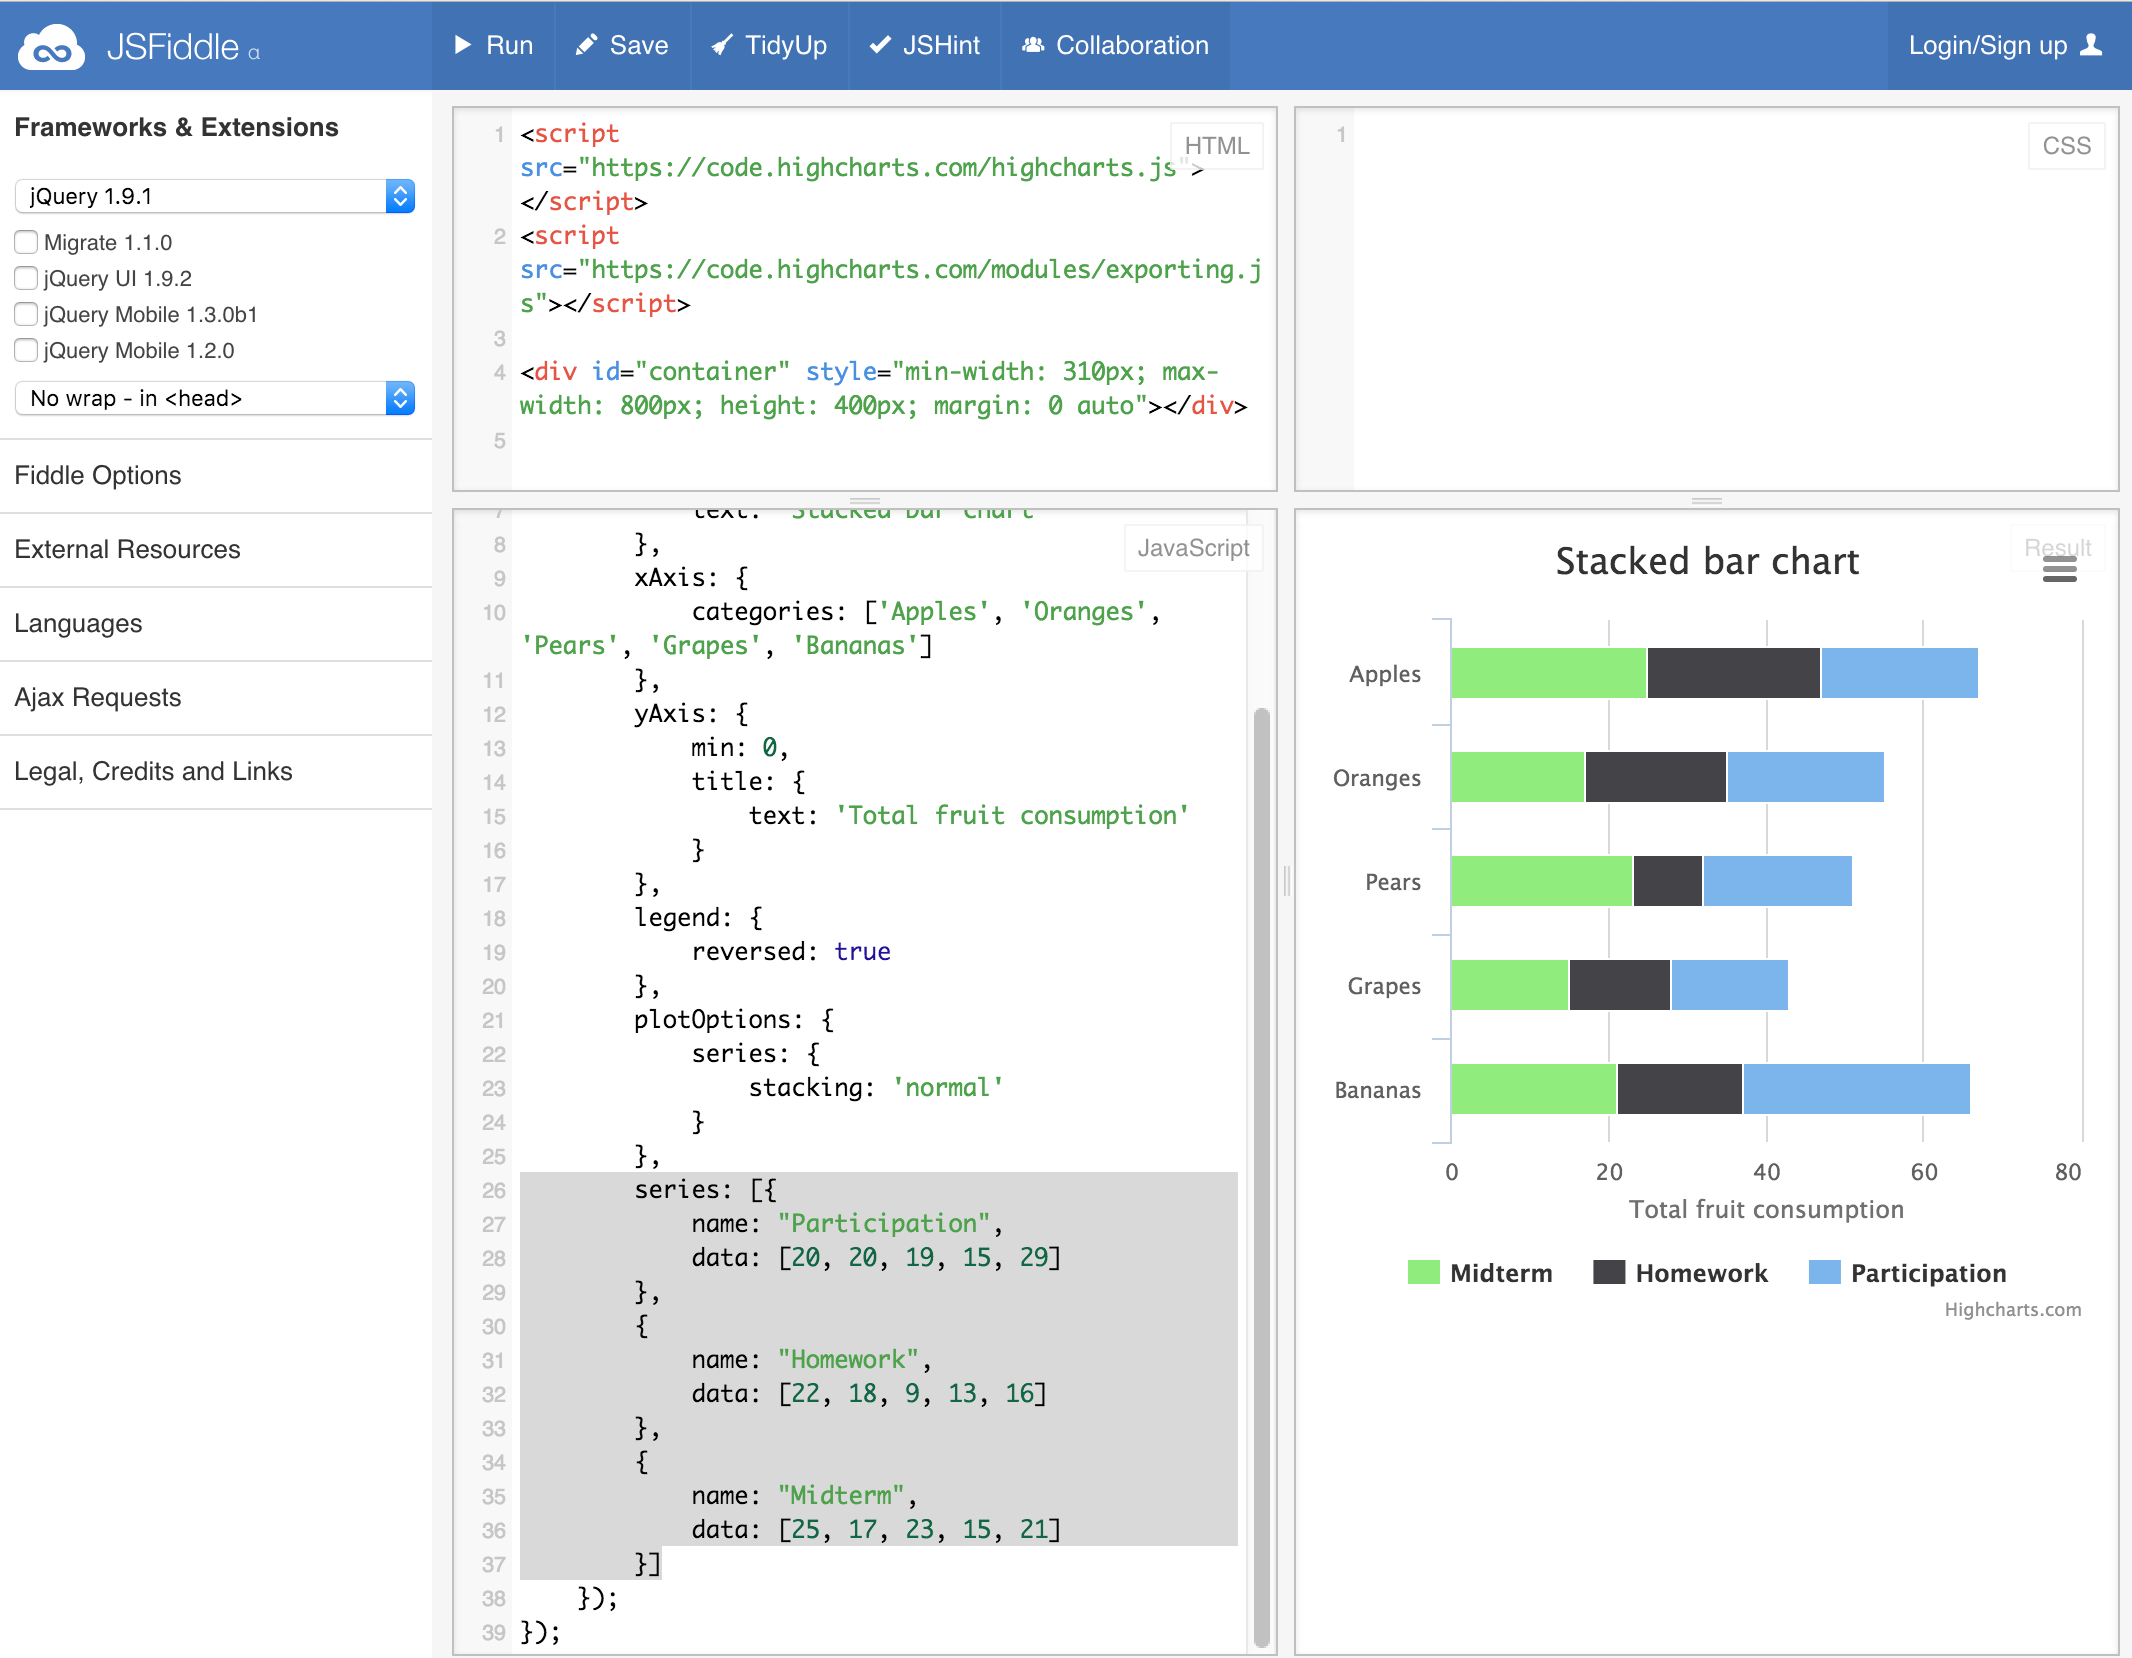
What if you have data like this on current grades in class.
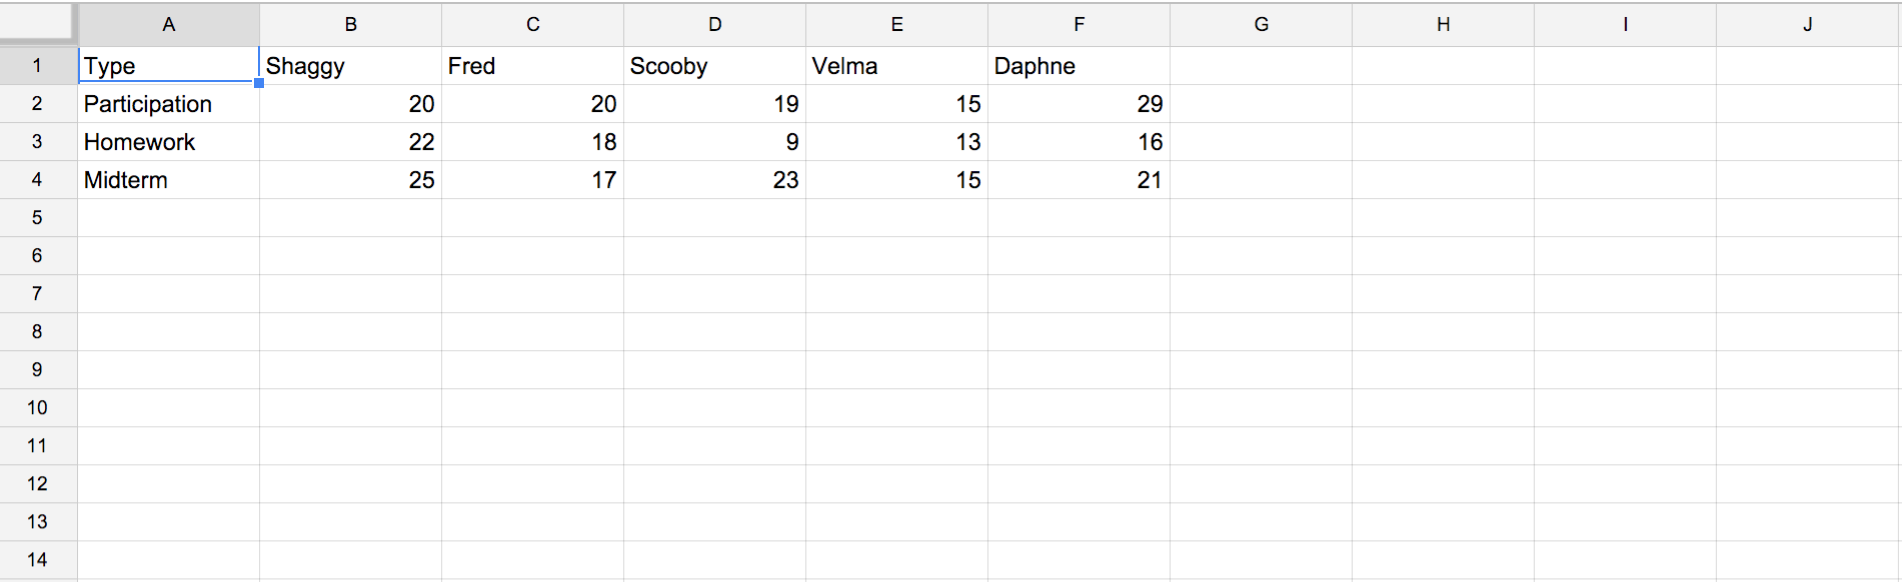
And want to turn it into this chart?
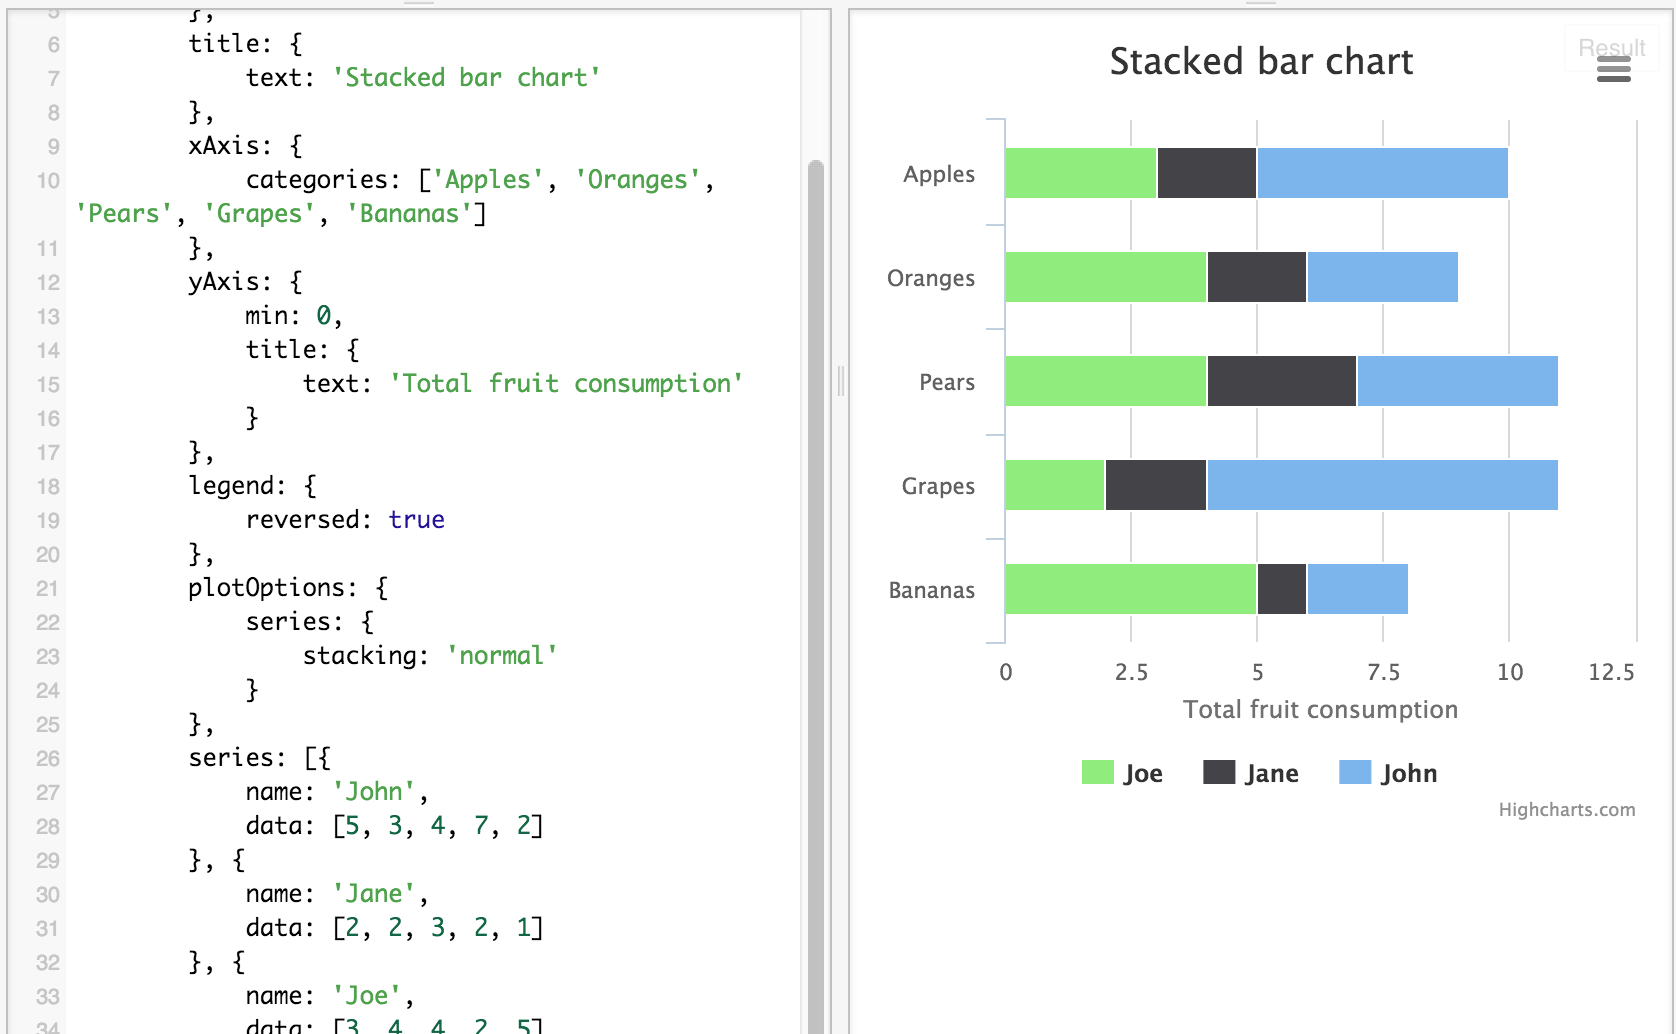
One option is to change it by hand.
Like, turn the fruits currently listed in categories to student names.
And then go to the series data and change the names in name to the type of scores (Homework, Participation, Midterm), and then change the data to the grades.
All by hand.
This is fine if you don't have a lot of data.
But let's say you don't have the time to do it all.
You can use Open Refine.
Advanced converting using Google Refine
Take a CSV of the data (If you're working in Google Sheets, export it as a CSV)
Import it into Google Refine and Create Project.
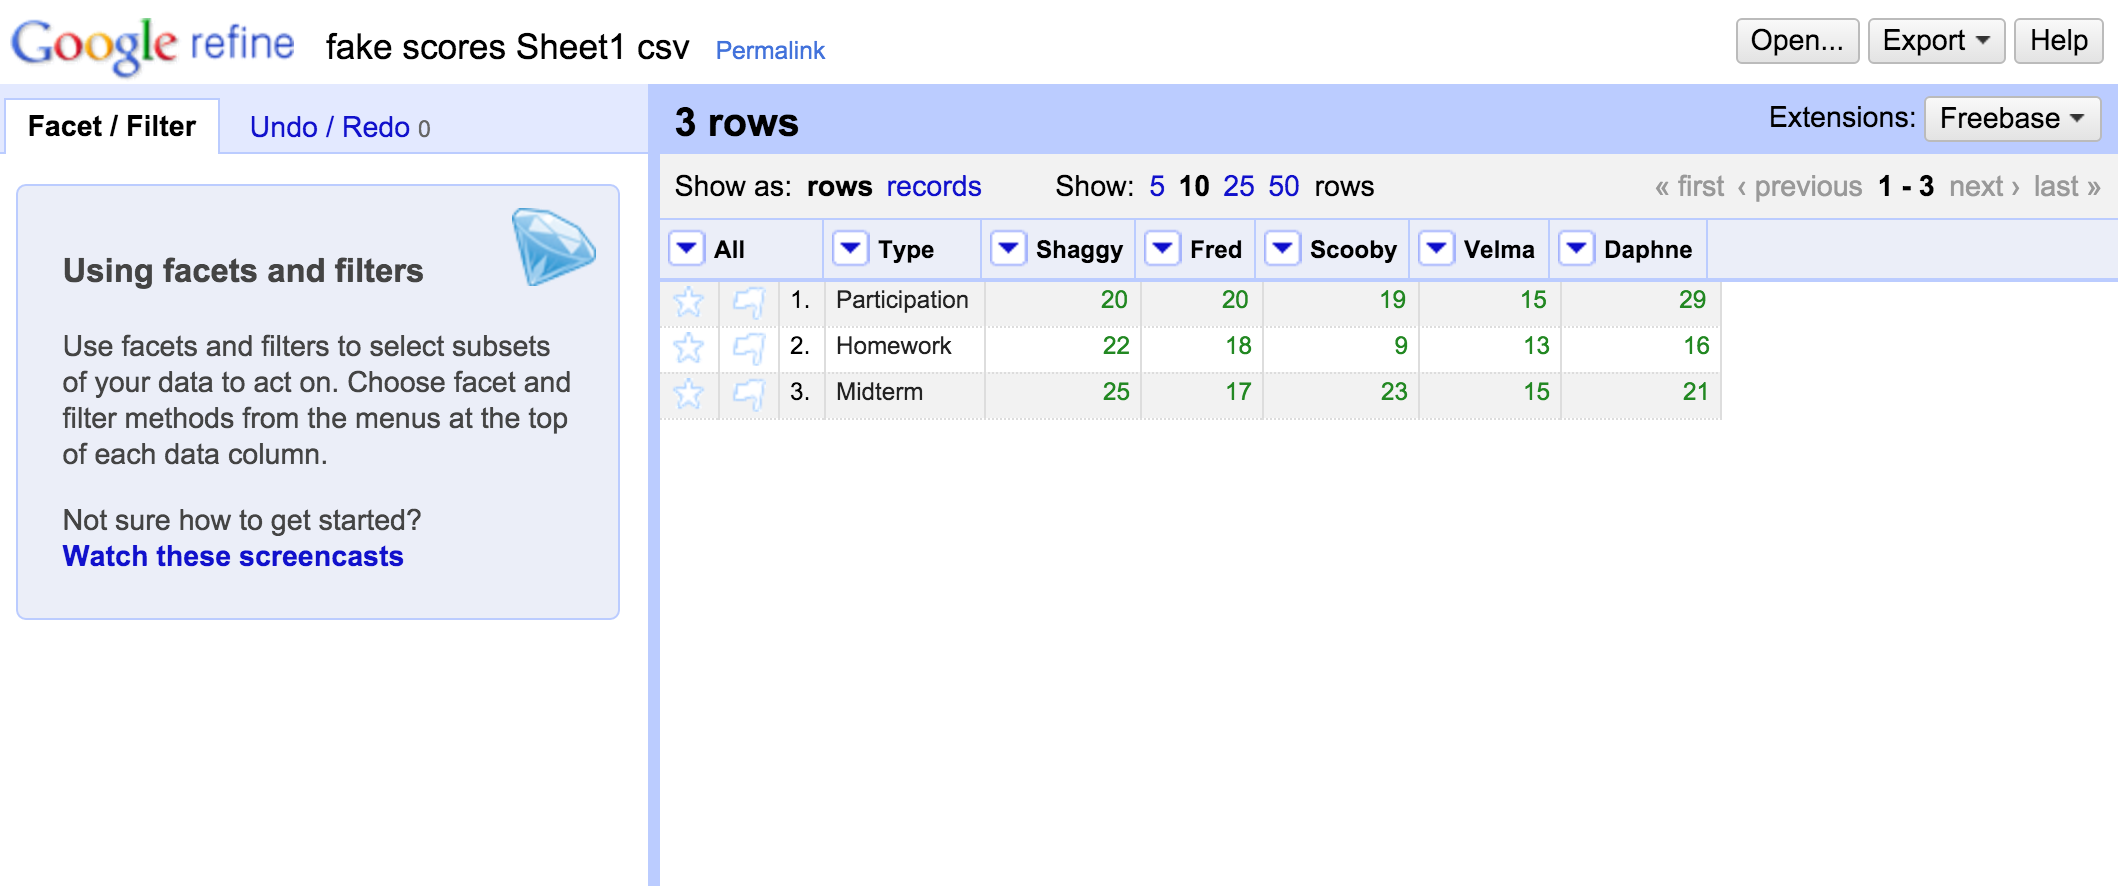
This should look familiar-- we used it to clean up data before.
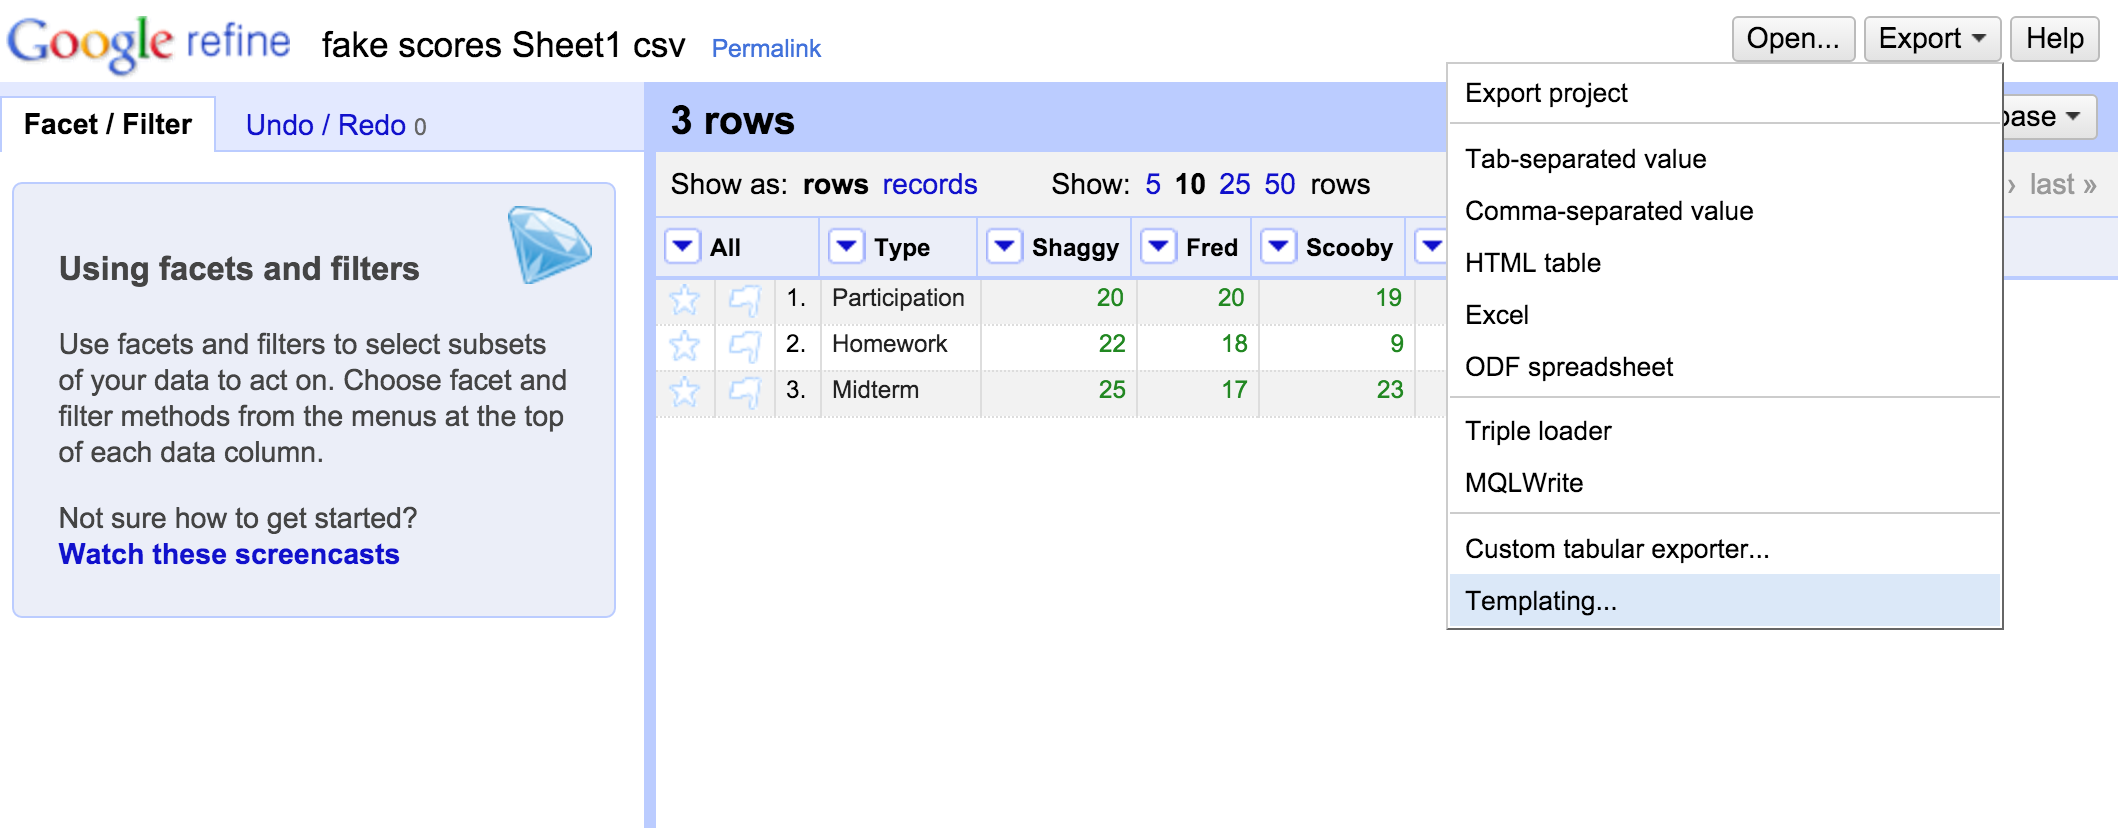
Click on Export at the top right and then select Templating.
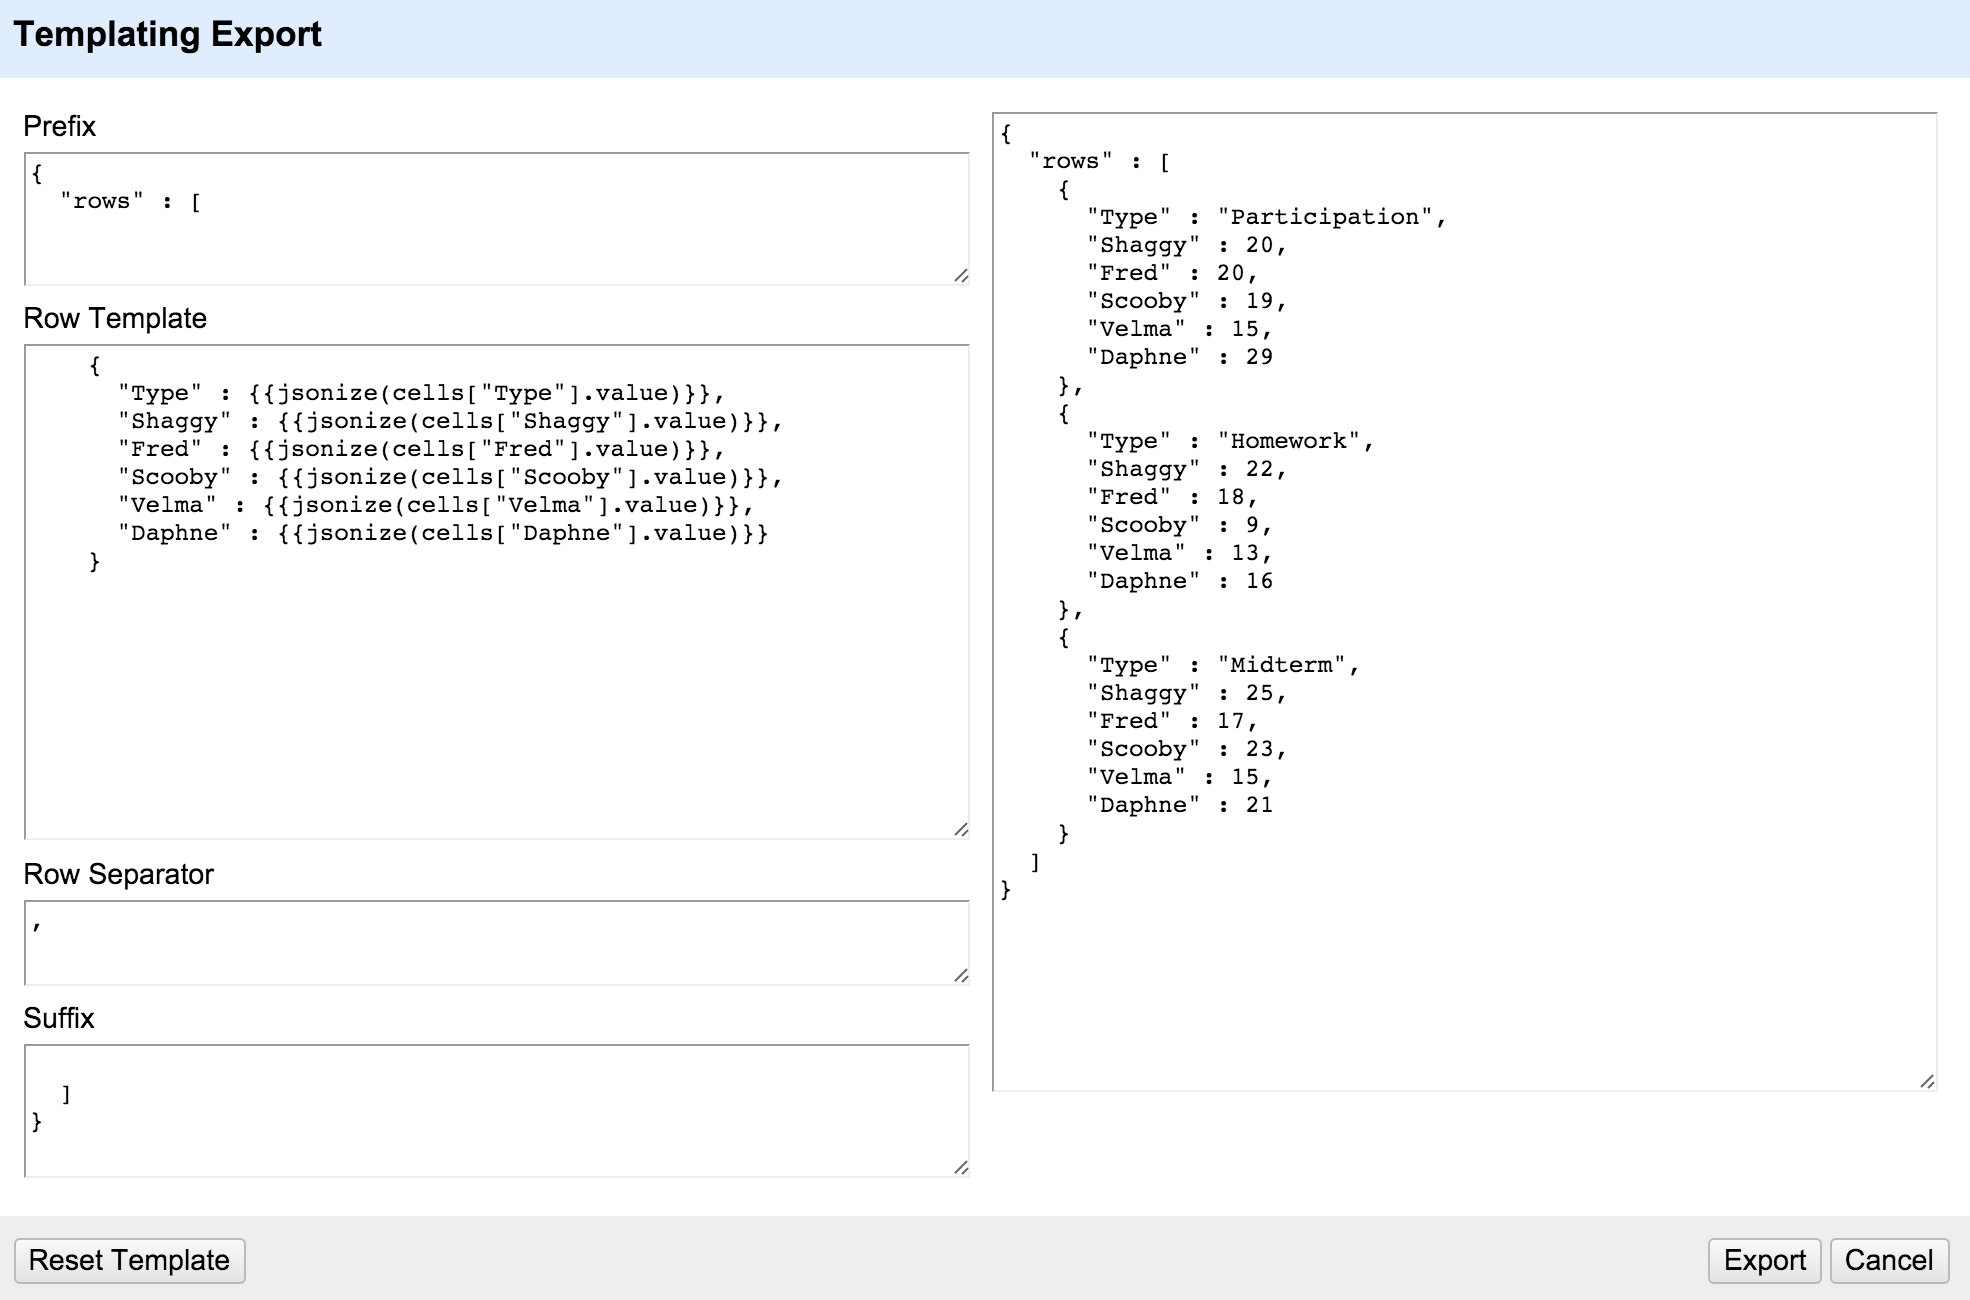
This is how the JSON would look if you clicked Export at the bottom right.
But we need to make some adjustments in the boxes on the left.
The exported code needs to look like the image above.
So switch it up so it matches.
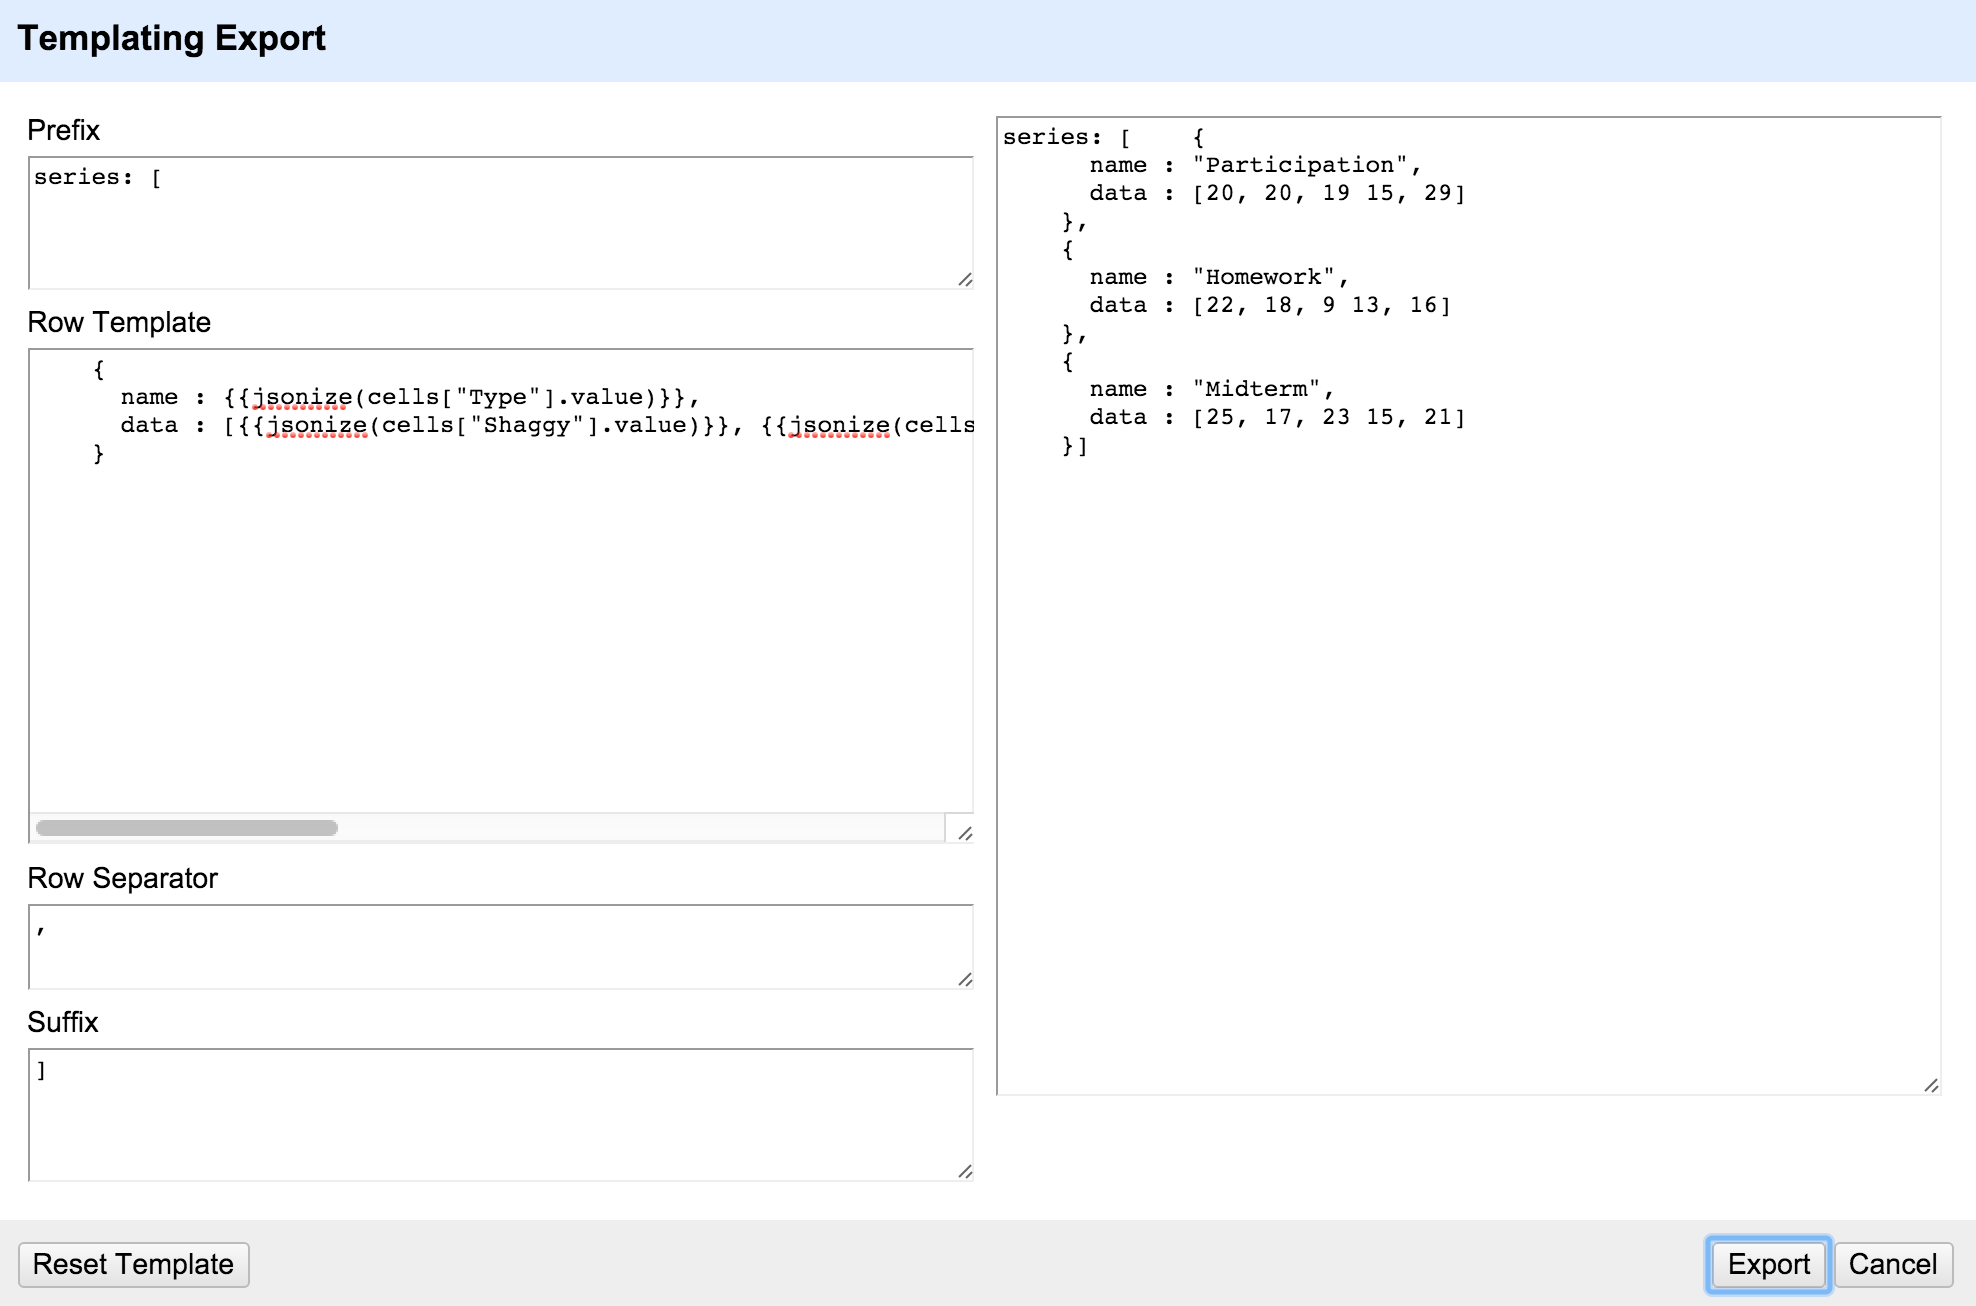
Keep the code in ****. That's referencing the data values.
Once you're done, click Export at the bottom right.
A text file will be downloaded.
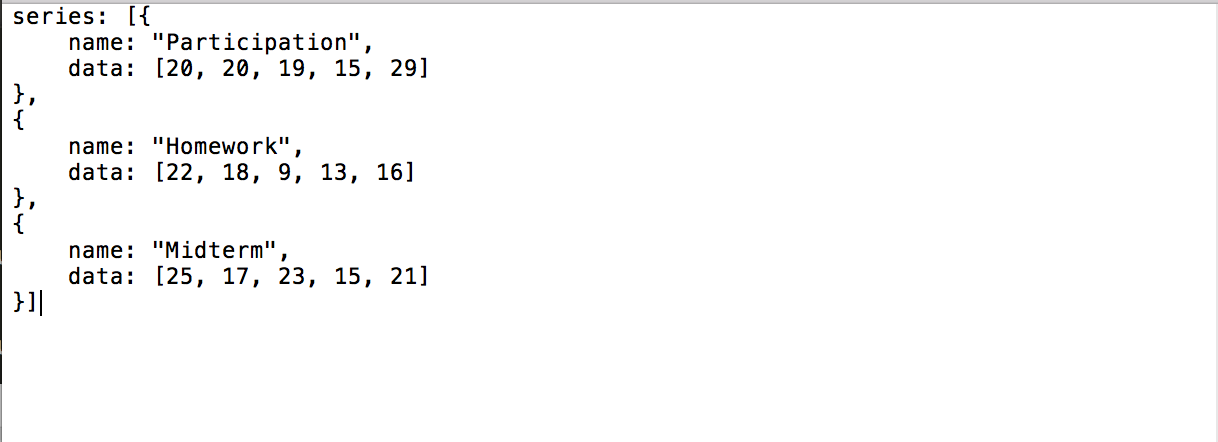
Open it up and replace the series data in this link.
Click Run at the top.
Close.
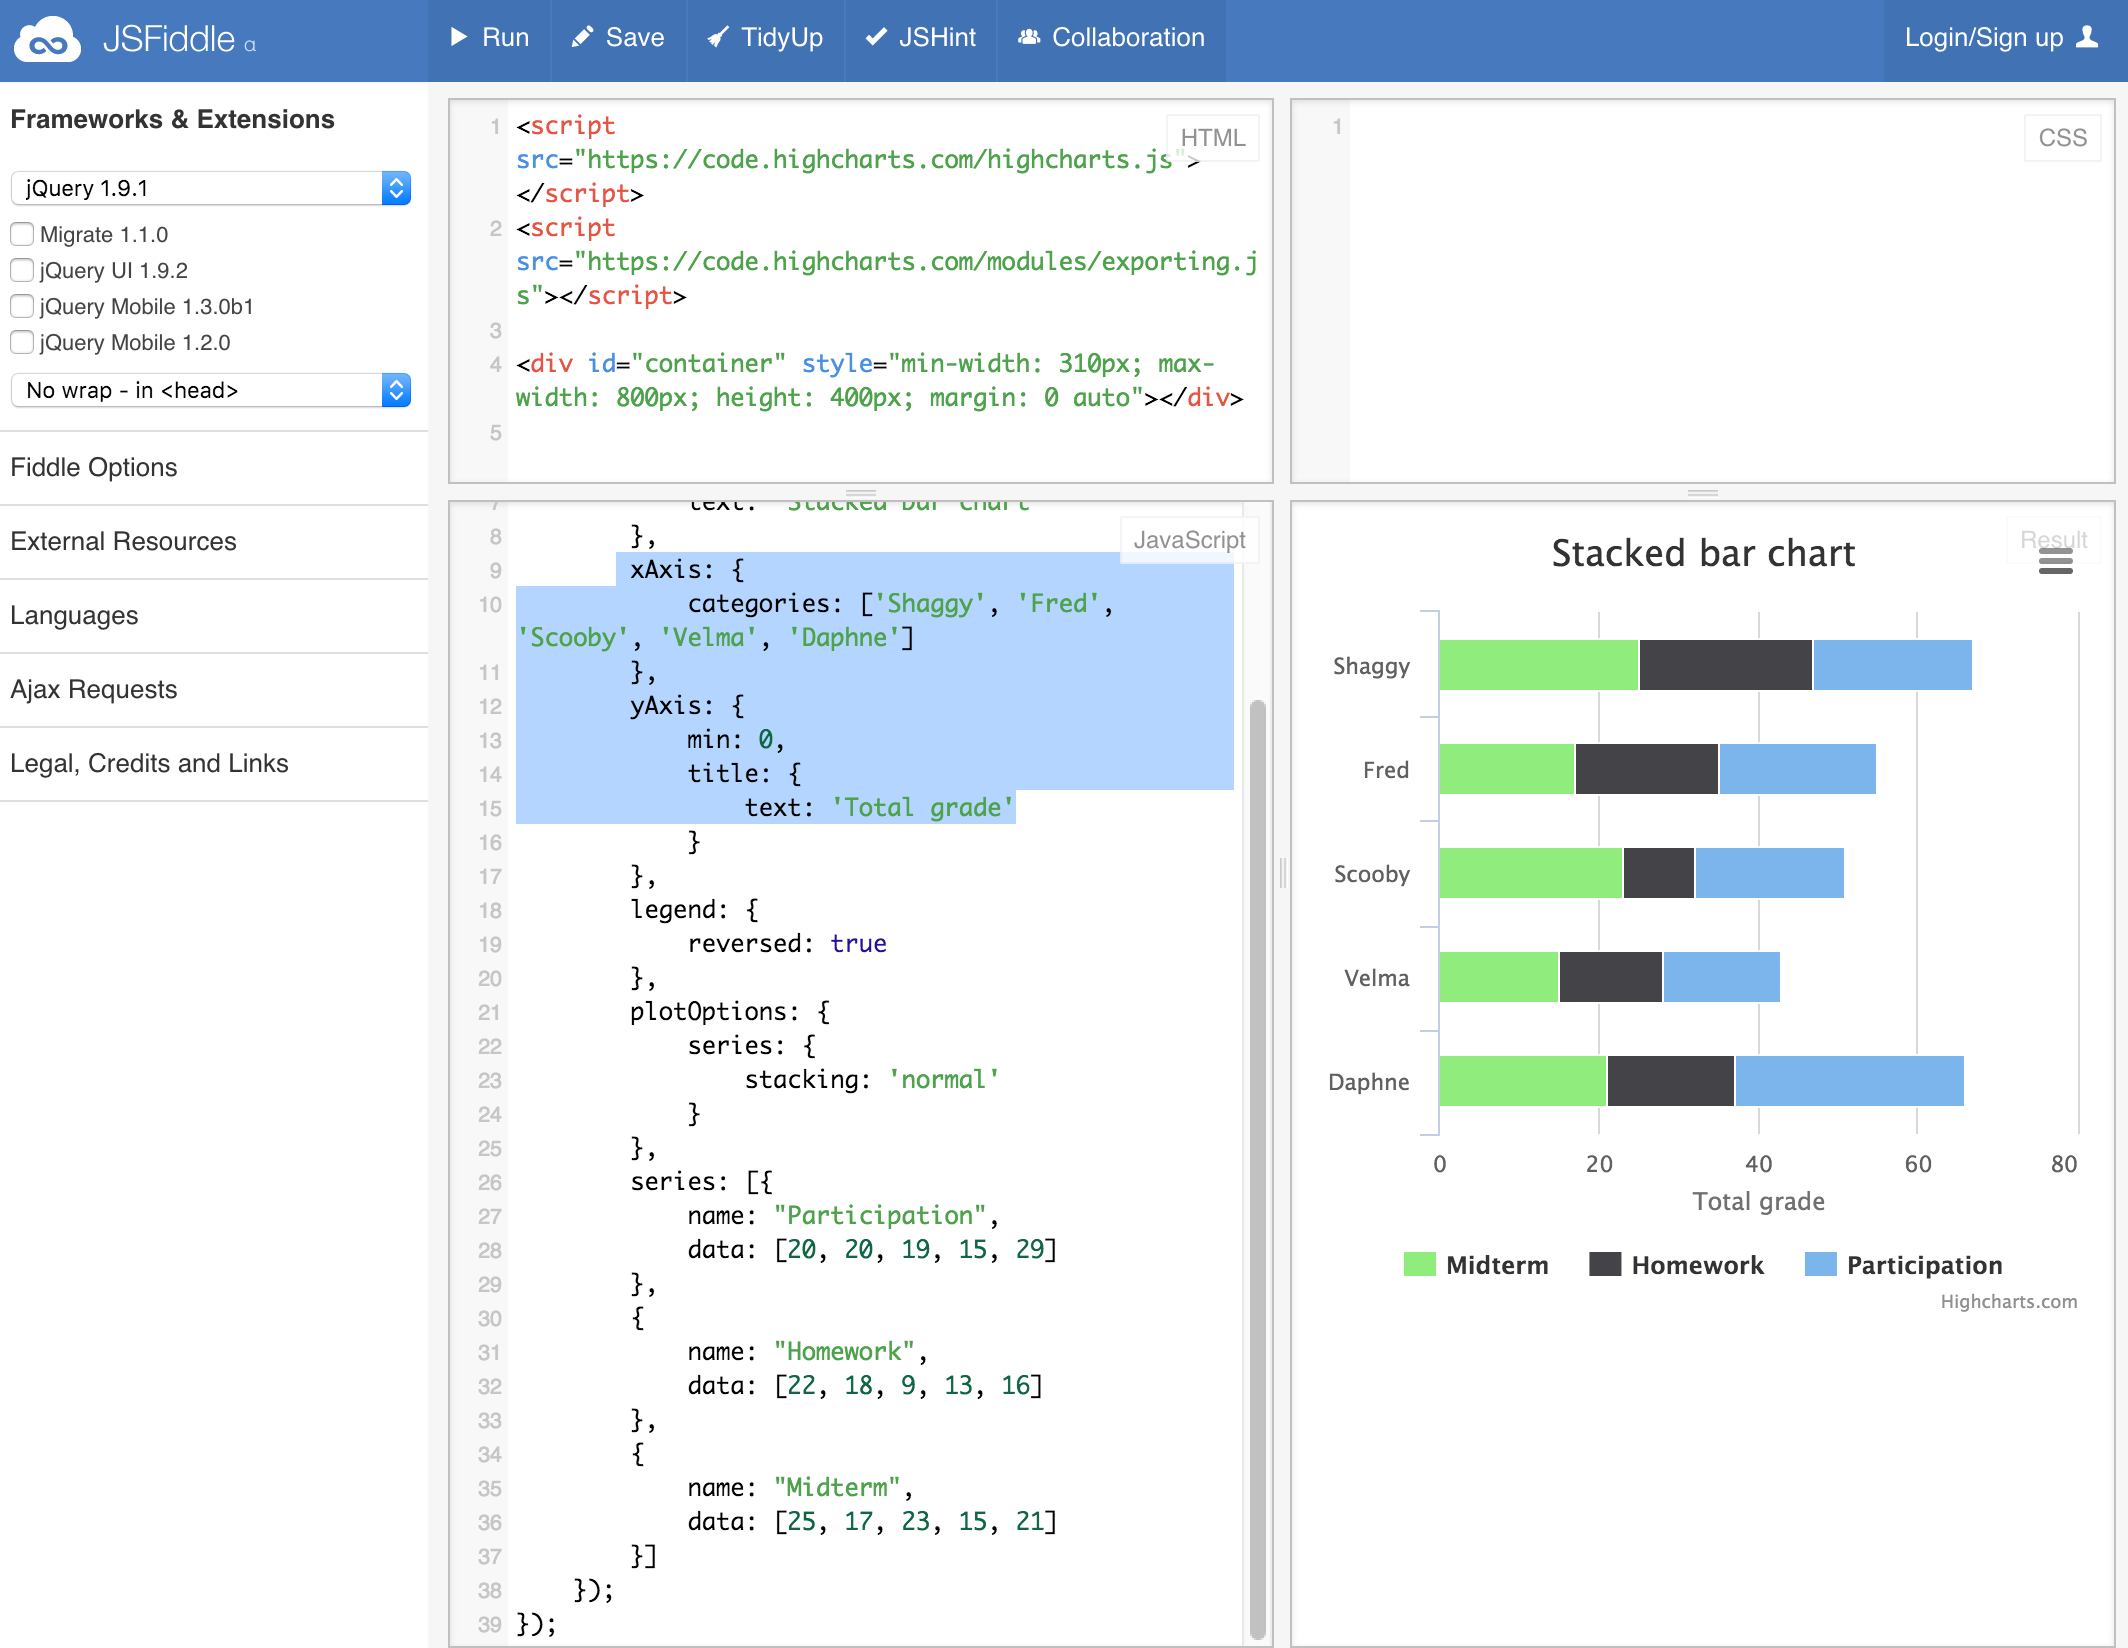
Now you need to change the text in categories.
Put the names in order of your data.
And also change text so it says 'Total grade'
From here you can take the code and put it into a new HTML, CSS, and Javascript file.
Or you can put it all inline.