More Fusion Tables fun - Choropleth maps
Let's make another map!
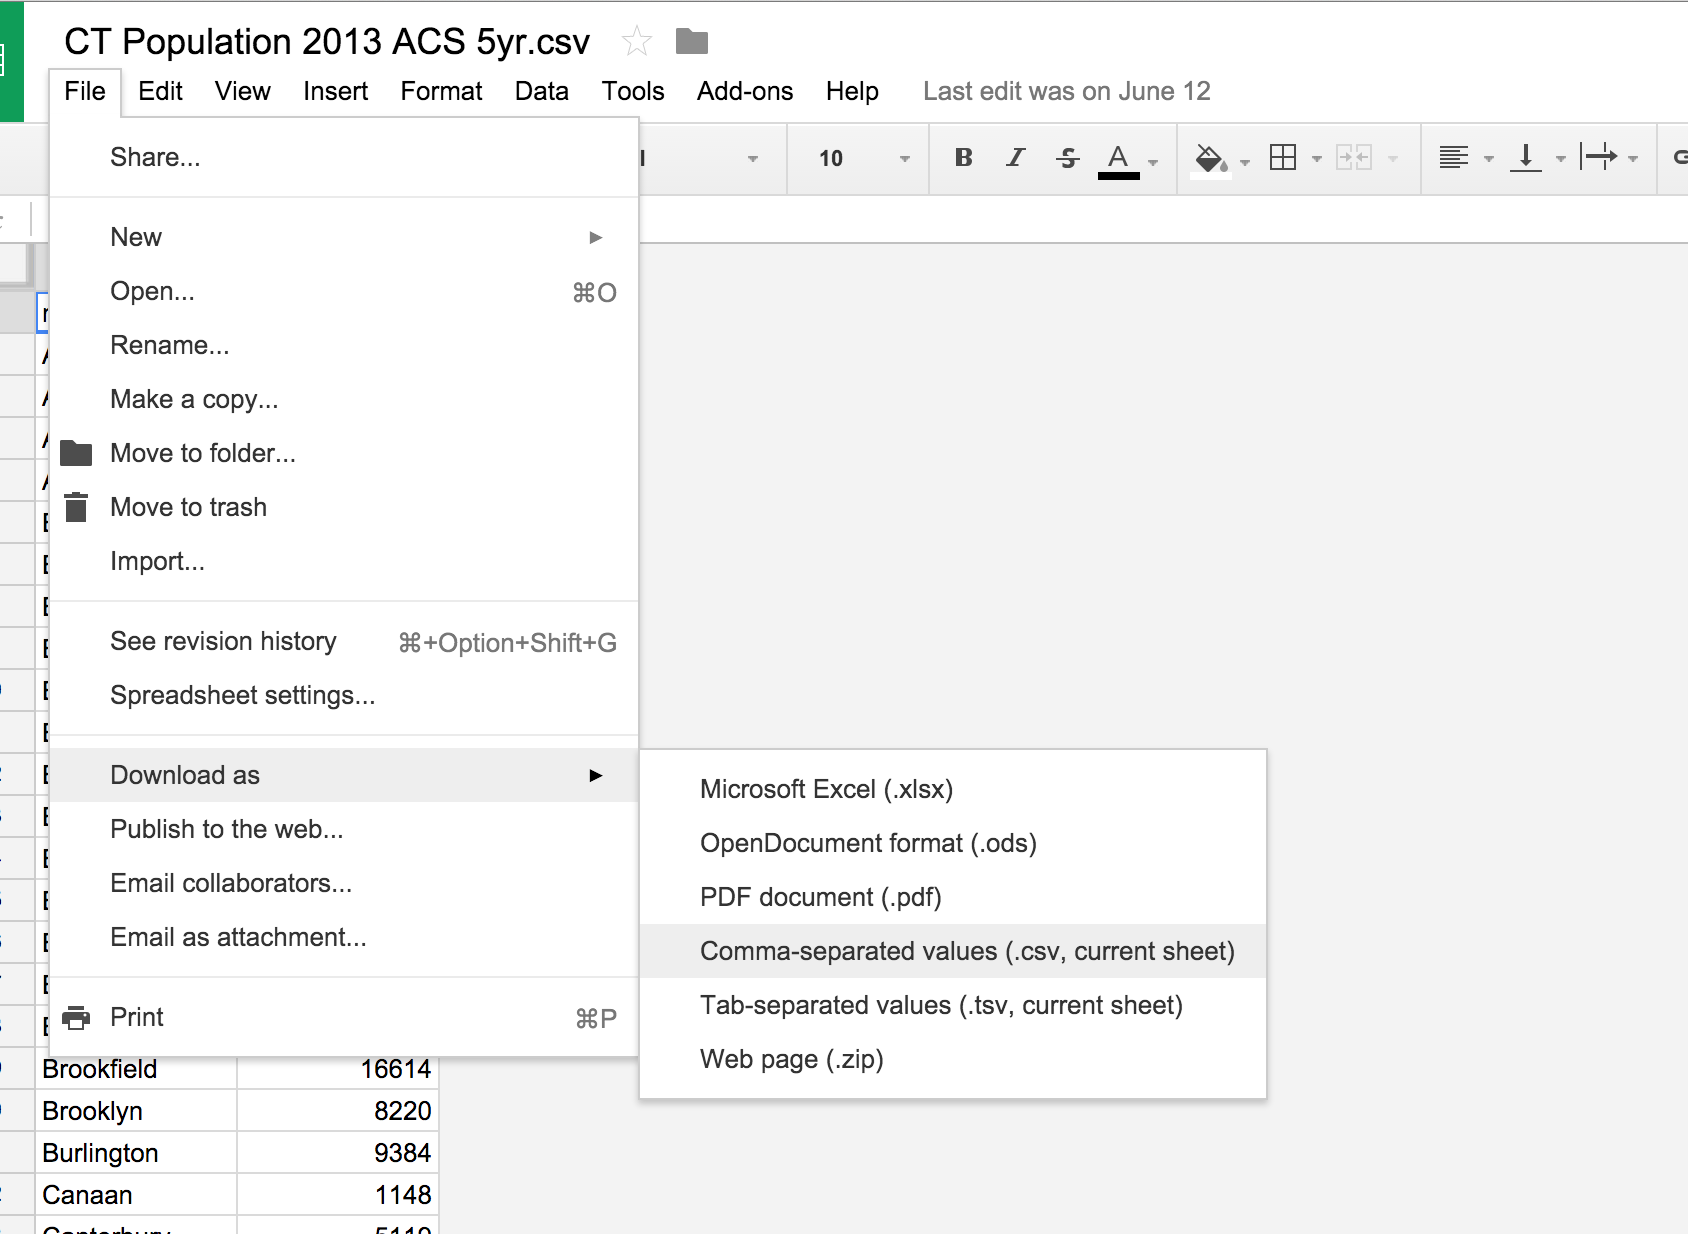
Download this data of town populations.
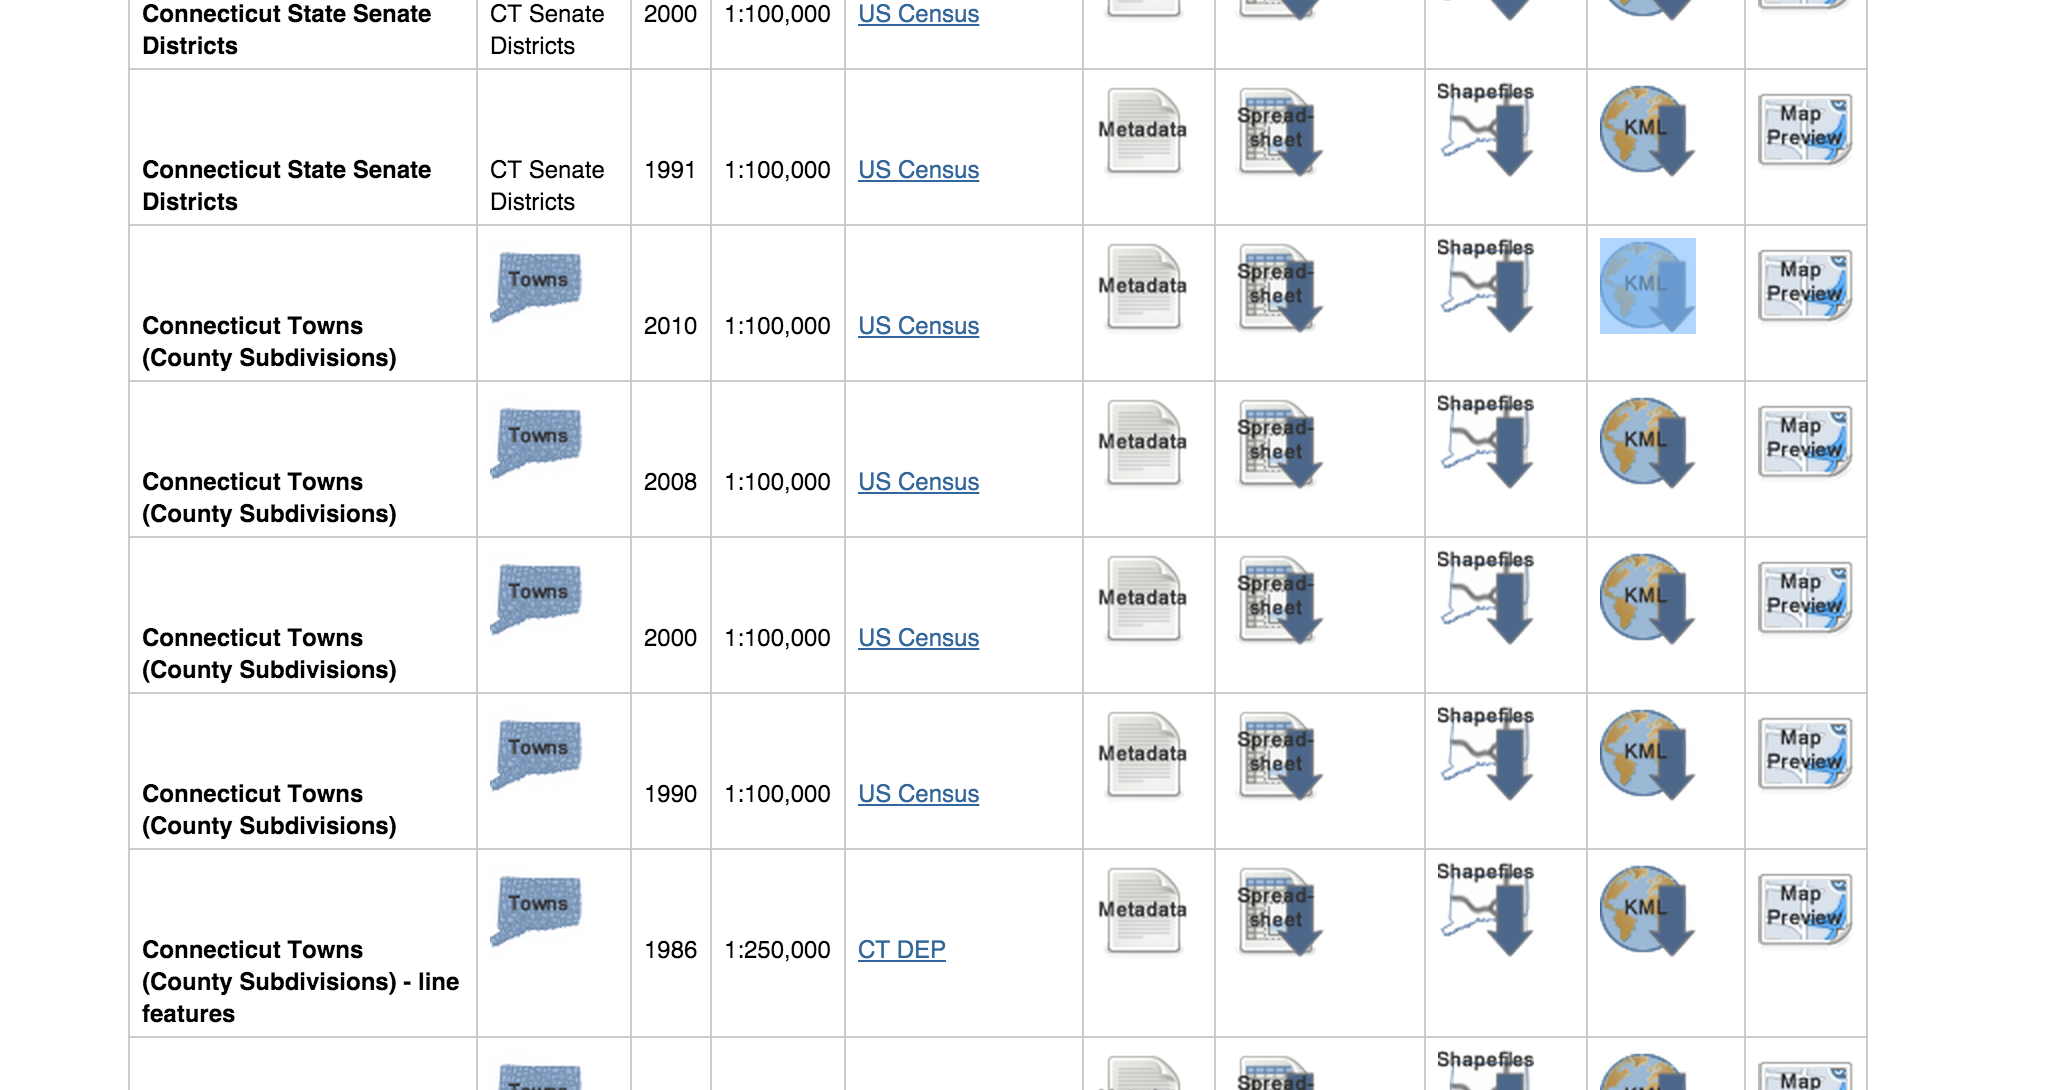
Download the .kml boundaries file for Connecticut Towns from magic.lib.uconn.edu.
Look for the 2010 version of Connecticut Towns
Unzip the file. If you can't, well, just download this file then.
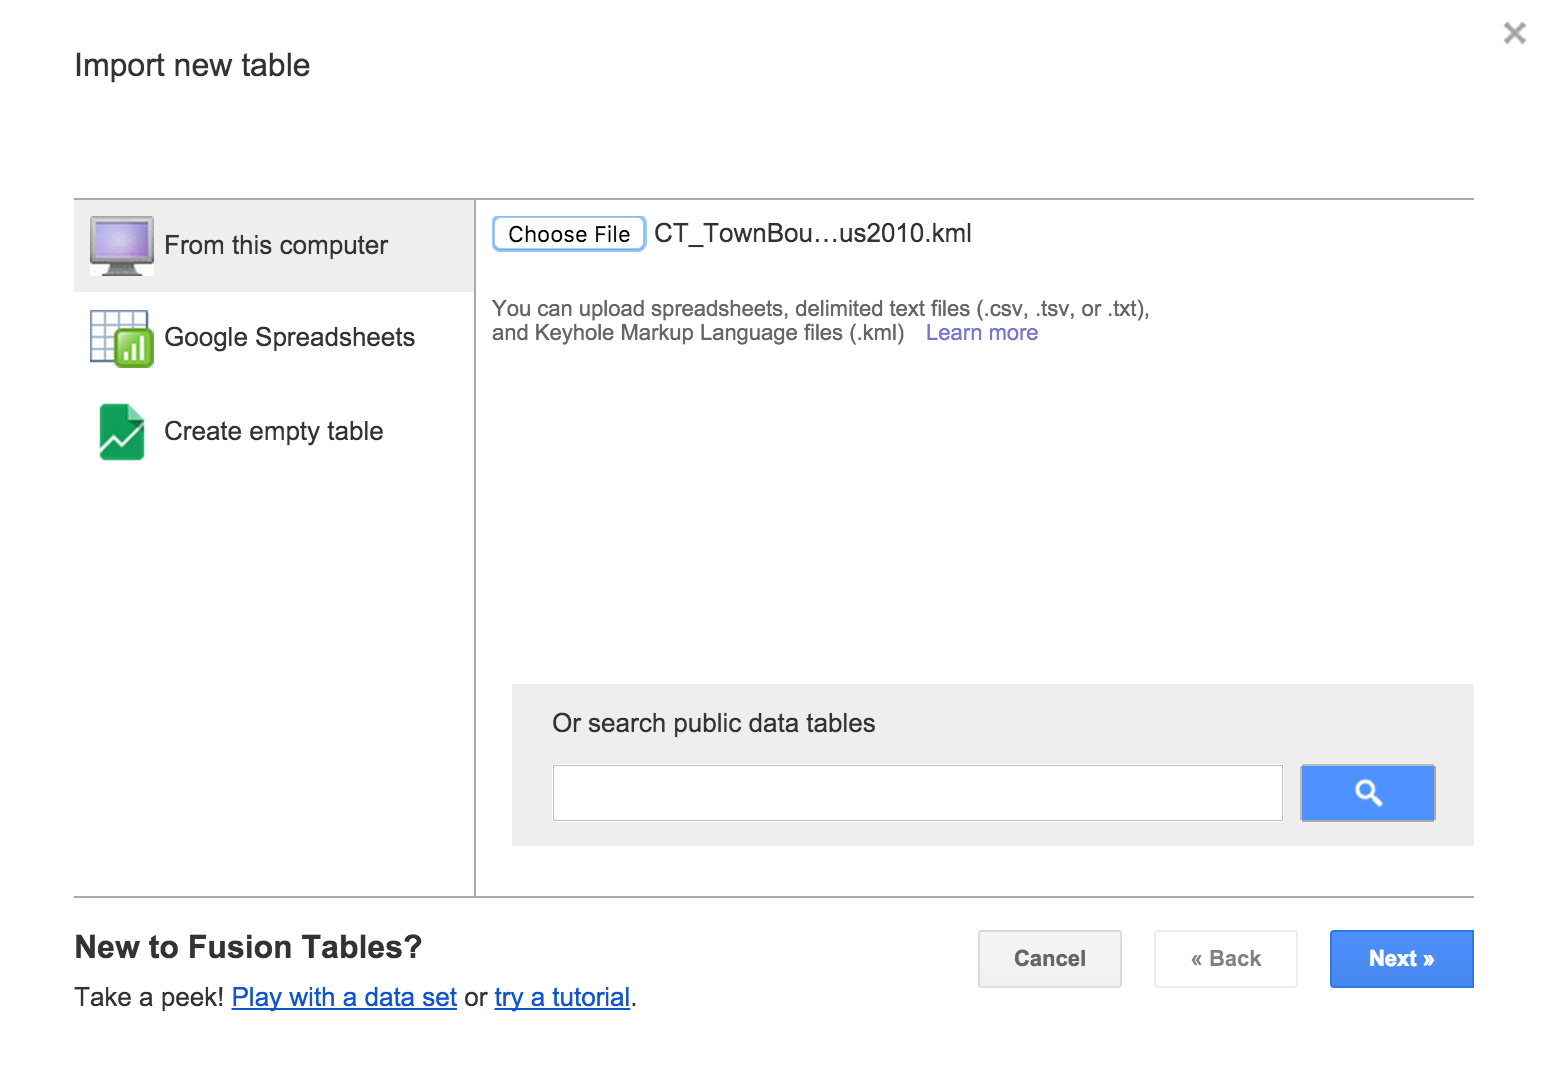
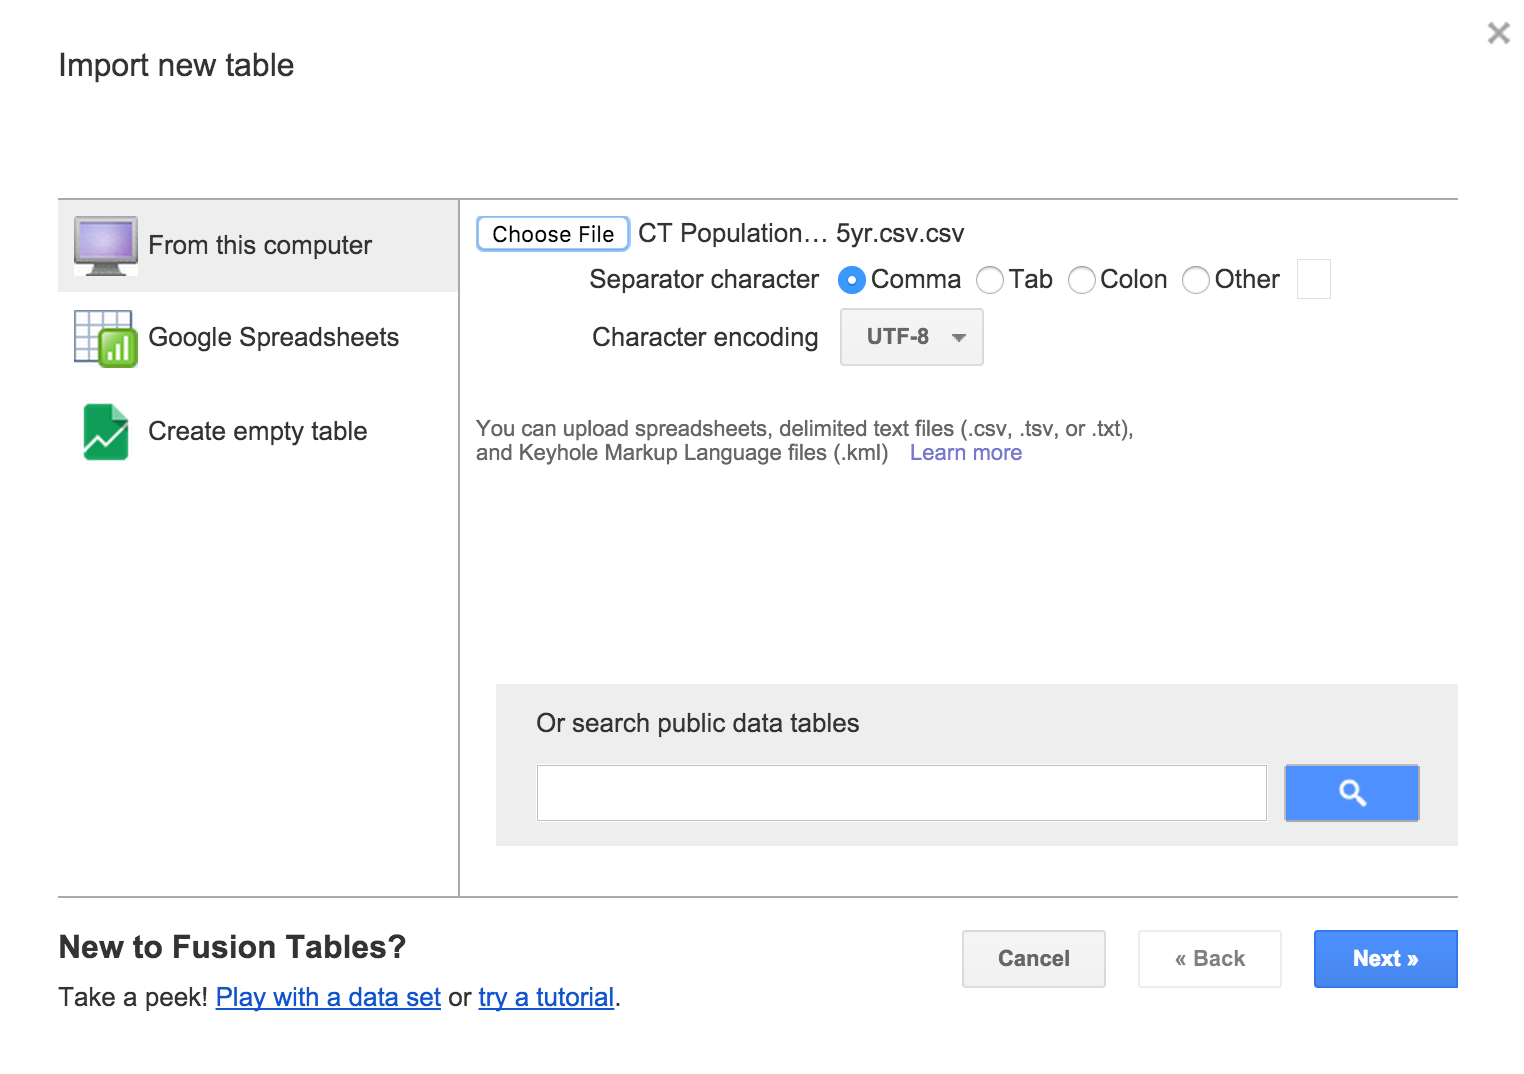
Bring the boundary file into Google Fusion Table.
Click next and finish
Click the Map of geometry tab and you've got a map!
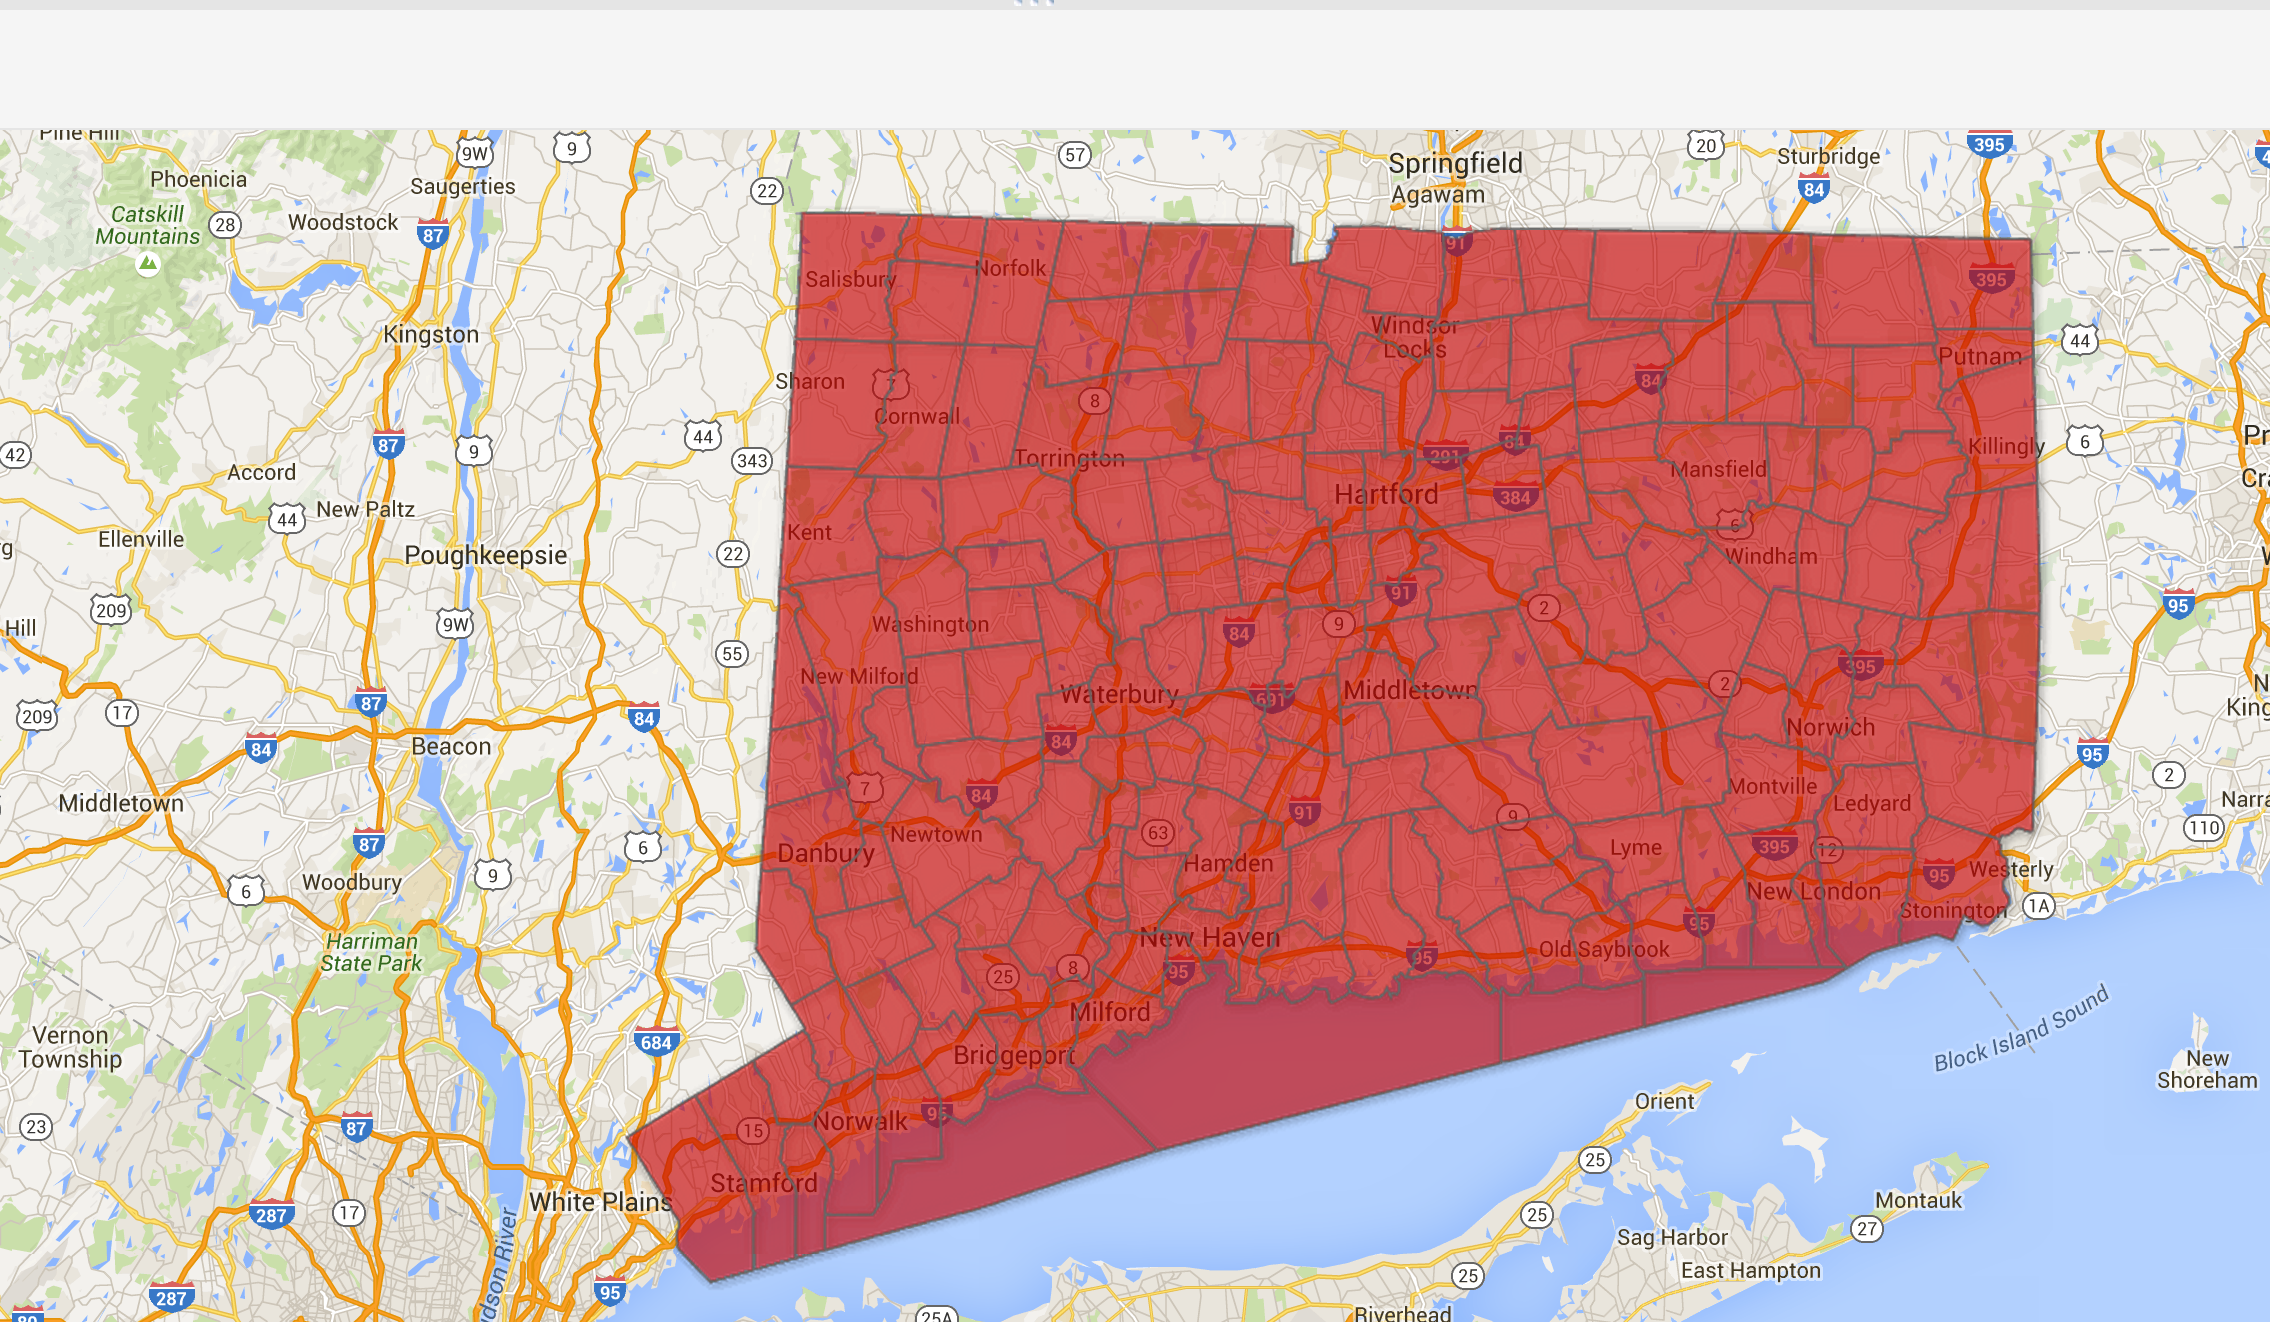
Not done yet. It's all a single color. That's boring.
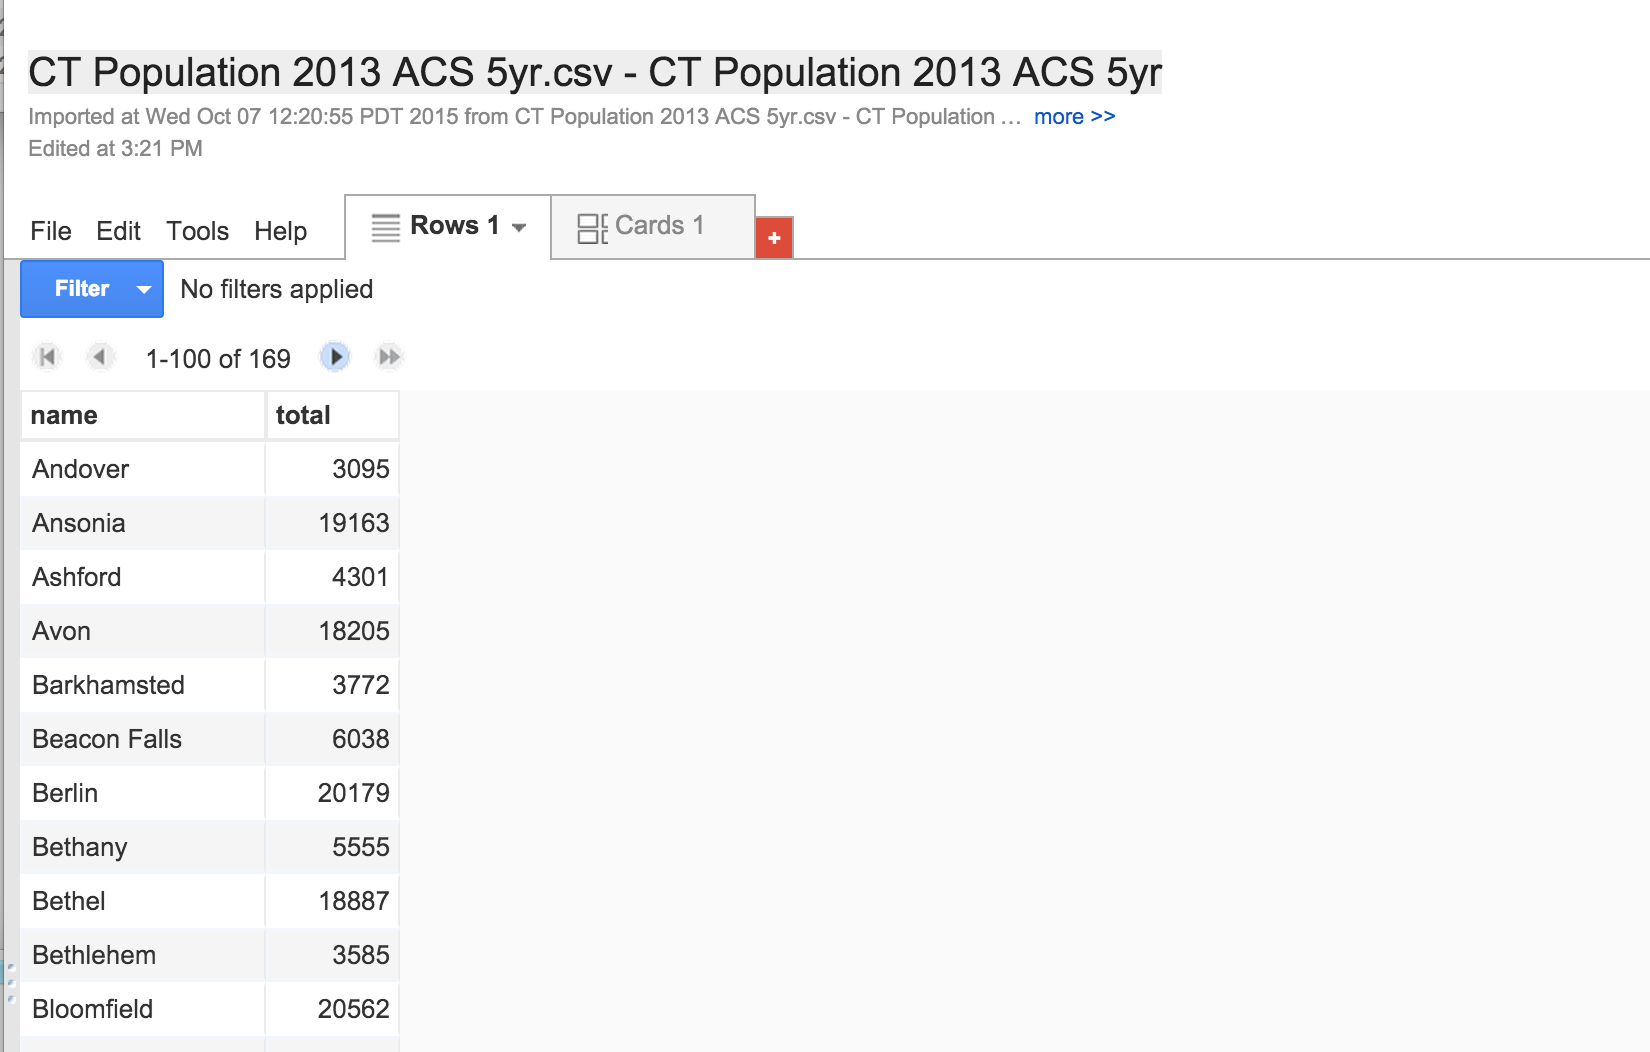
Make another Google Fusion Table using the population spreadsheet you downloaded earlier.
OK, looks alright.
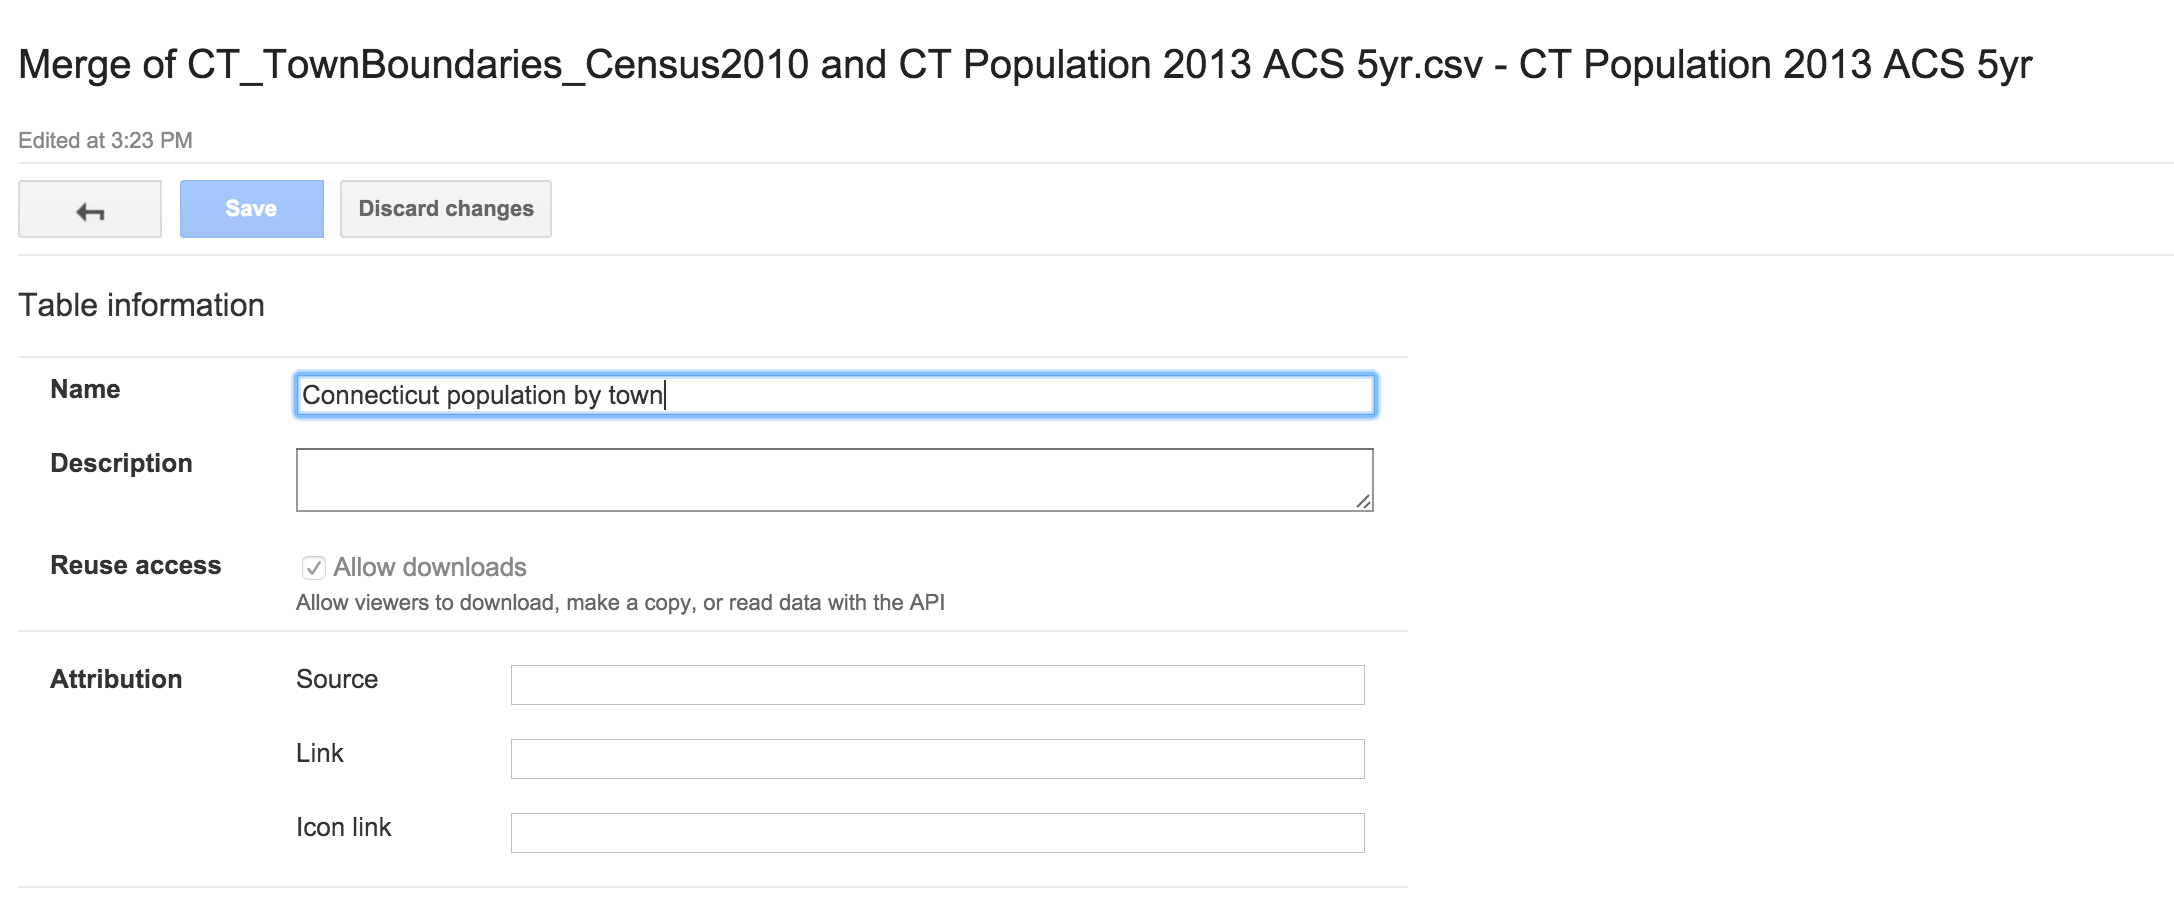
Go back to your map Google Fusion Table and click on merge.
Select the population table you just created.
Pull down the town menus you want them to match on: name and name.
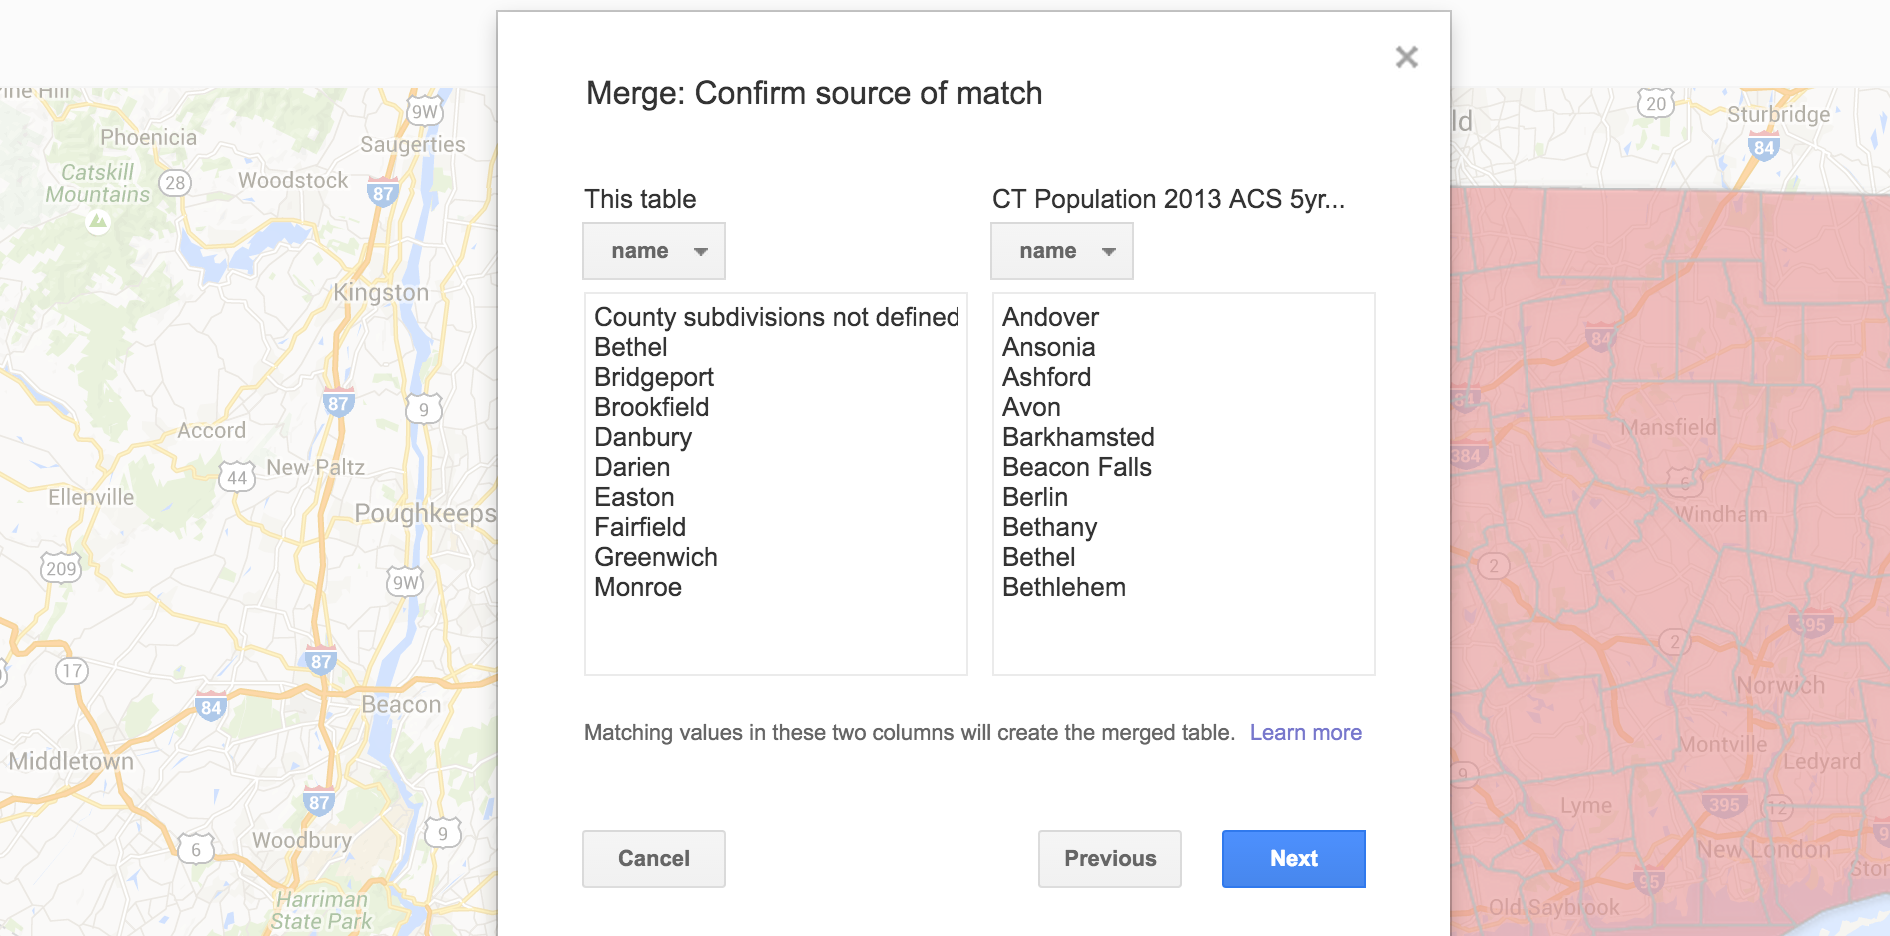
Click next to everything and check out the newly created table.
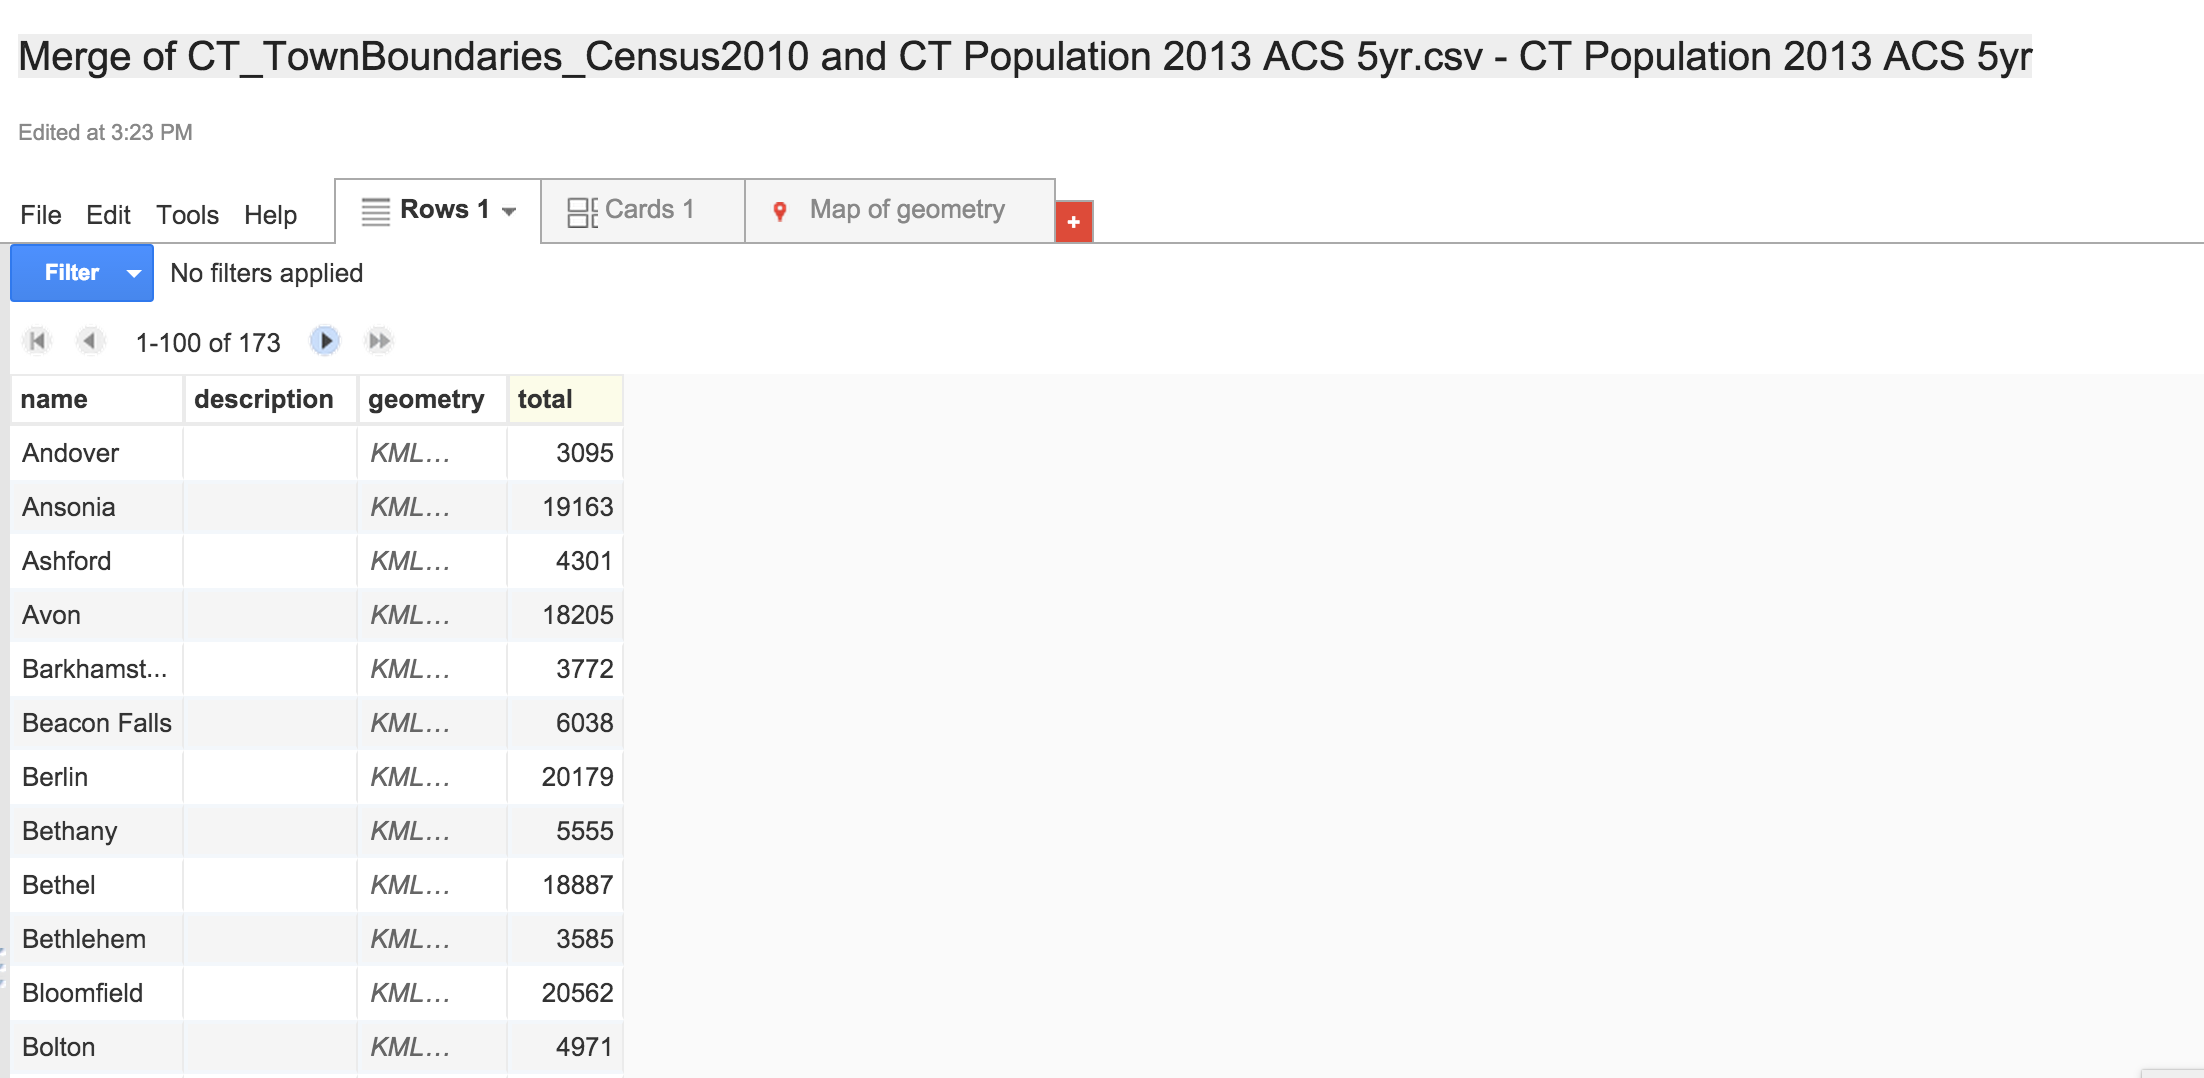
You'll probably want to rename it so you can find it later.
Check out the map tab again.
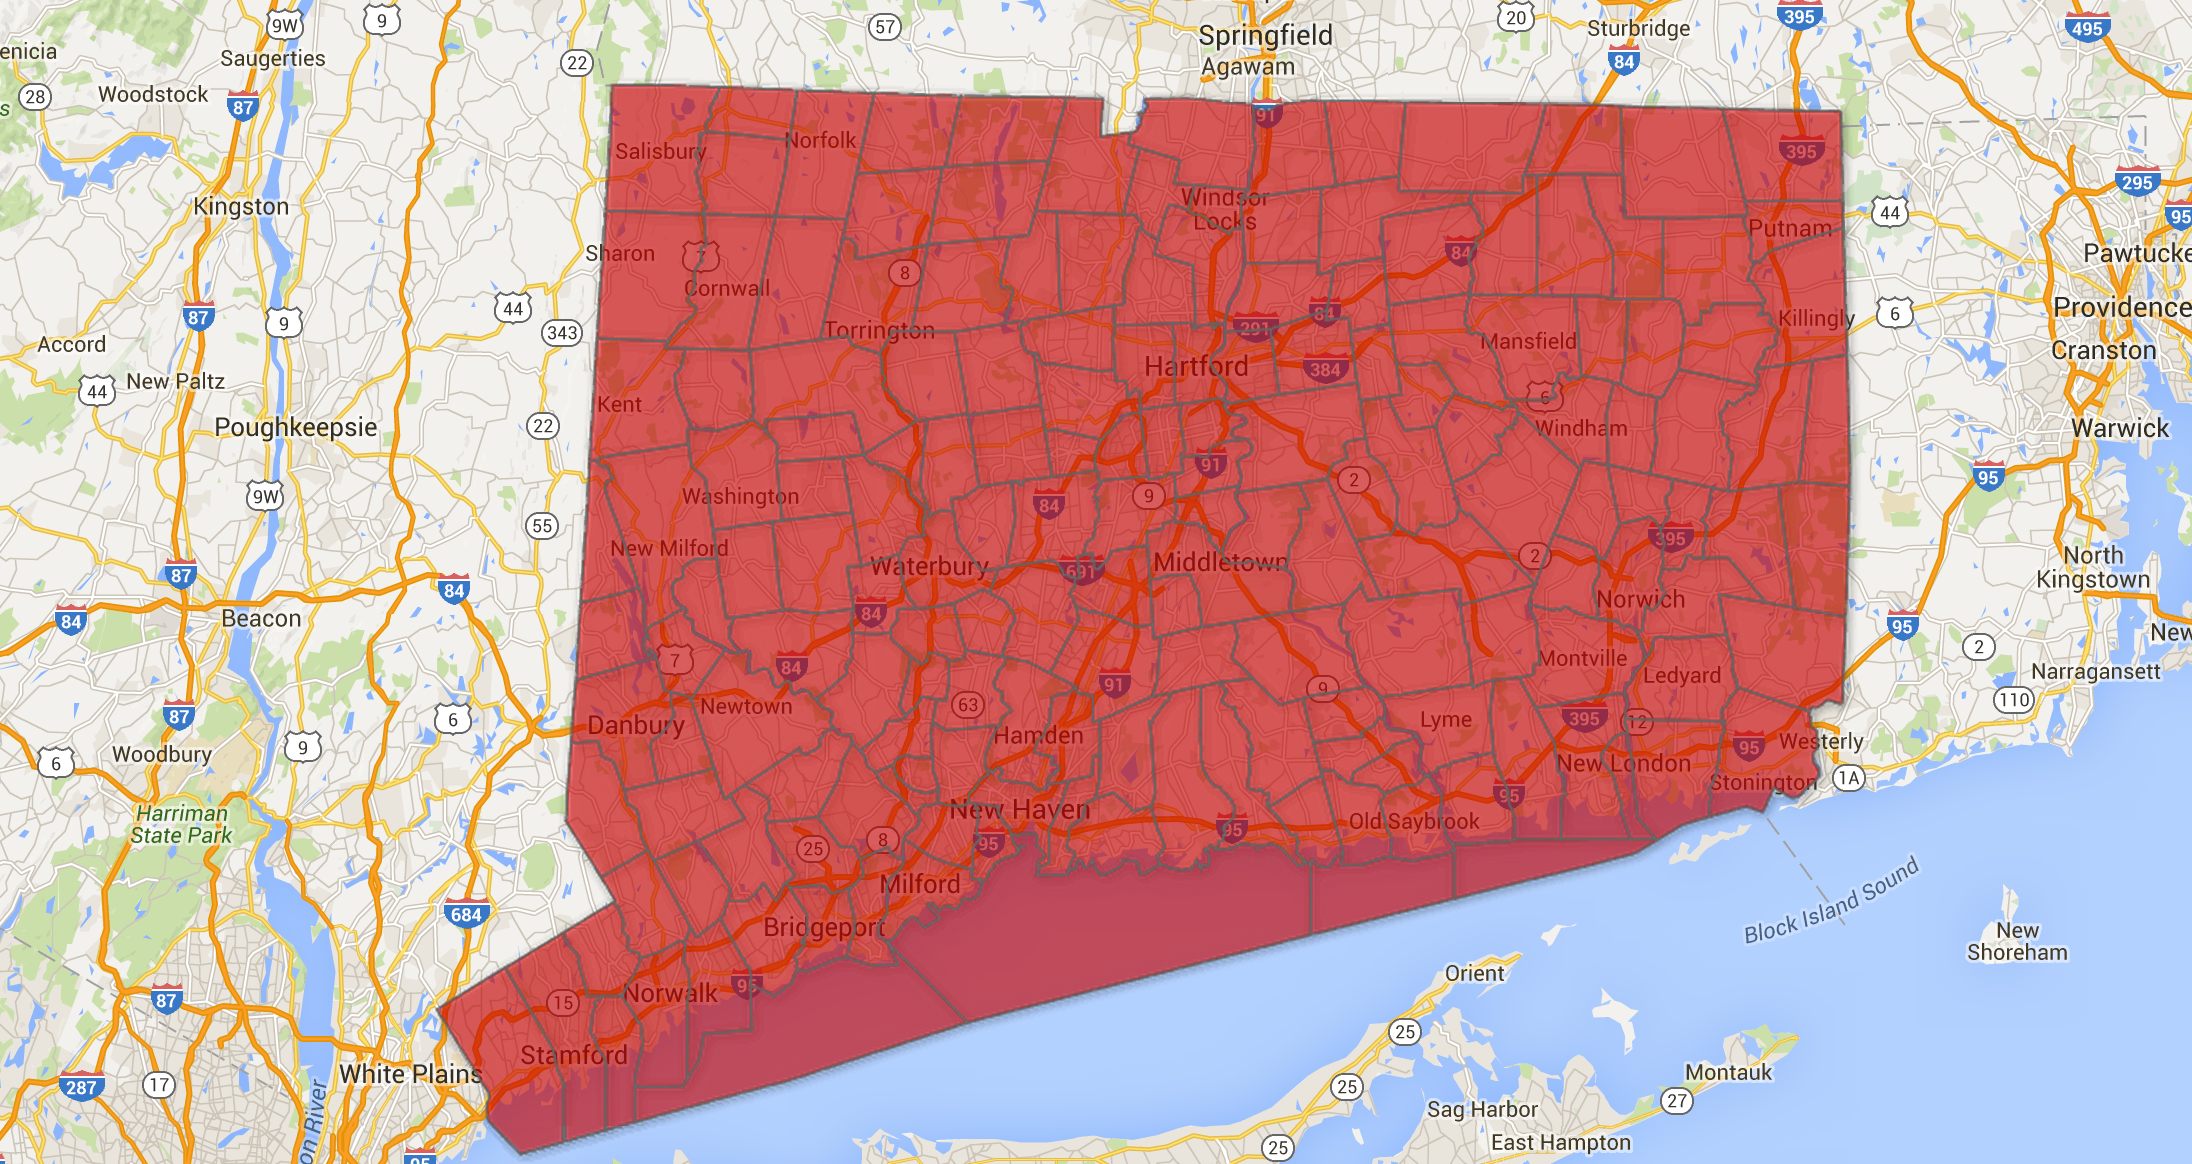
Yes, nothing has changed.
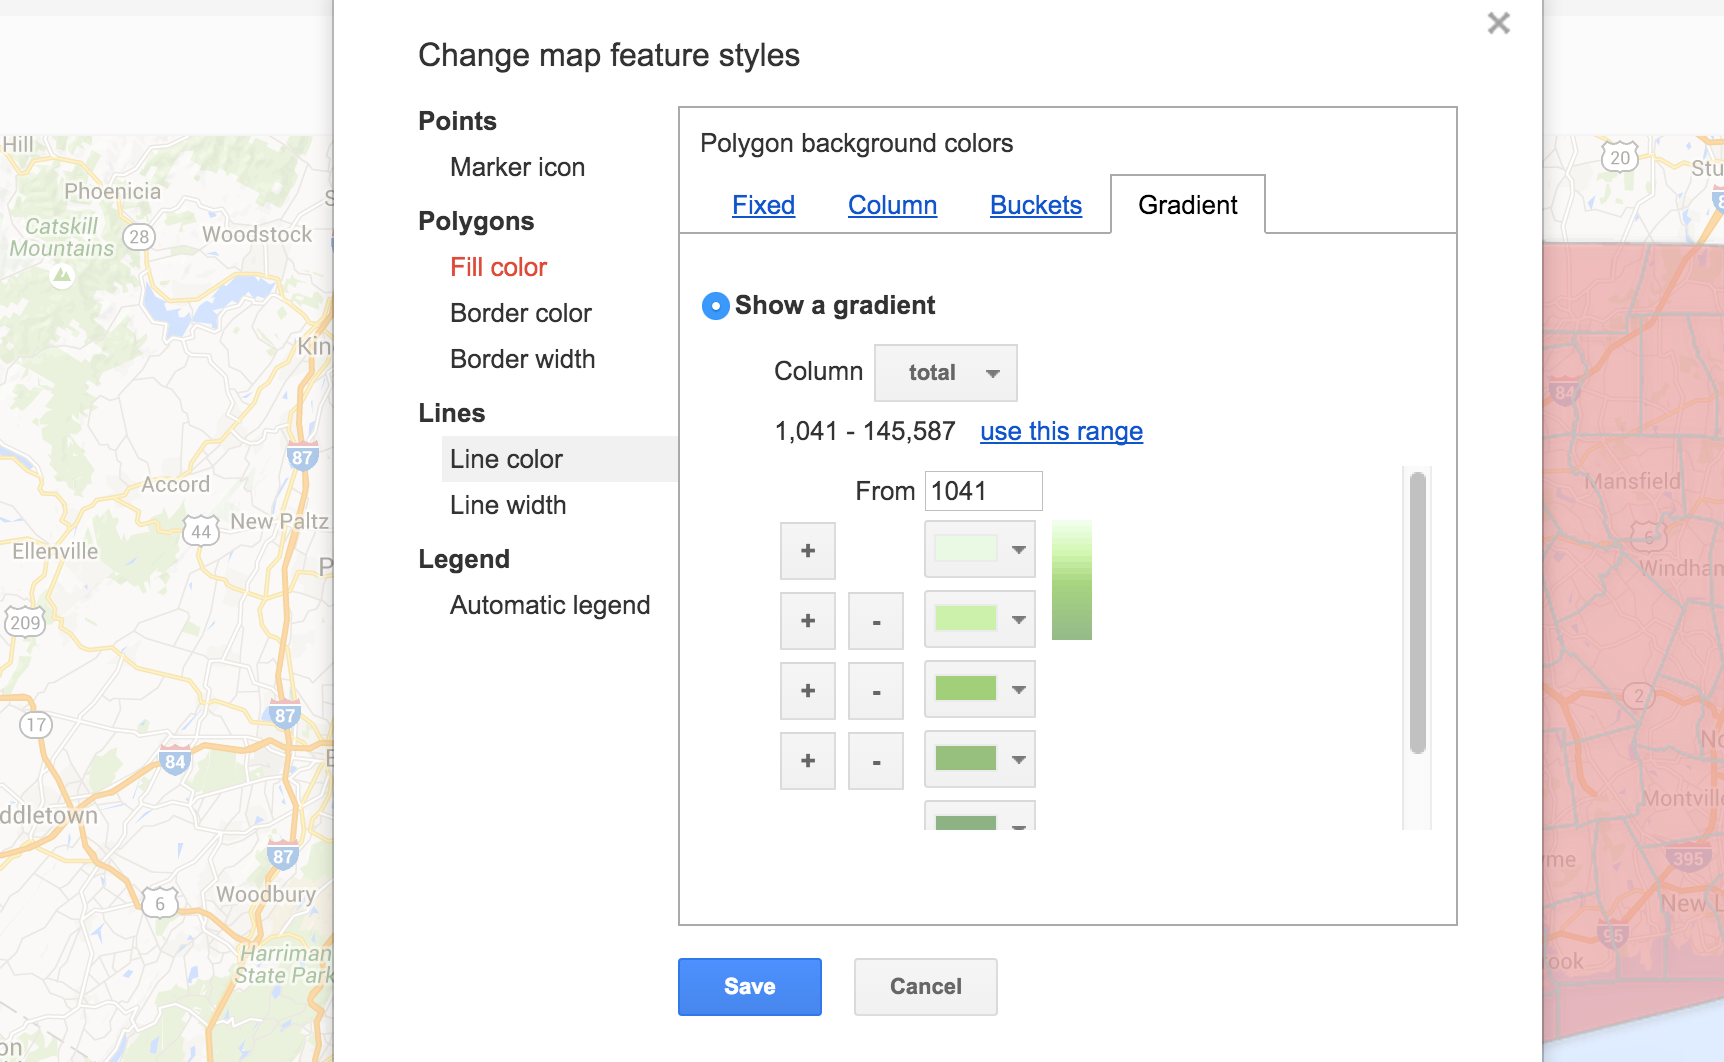
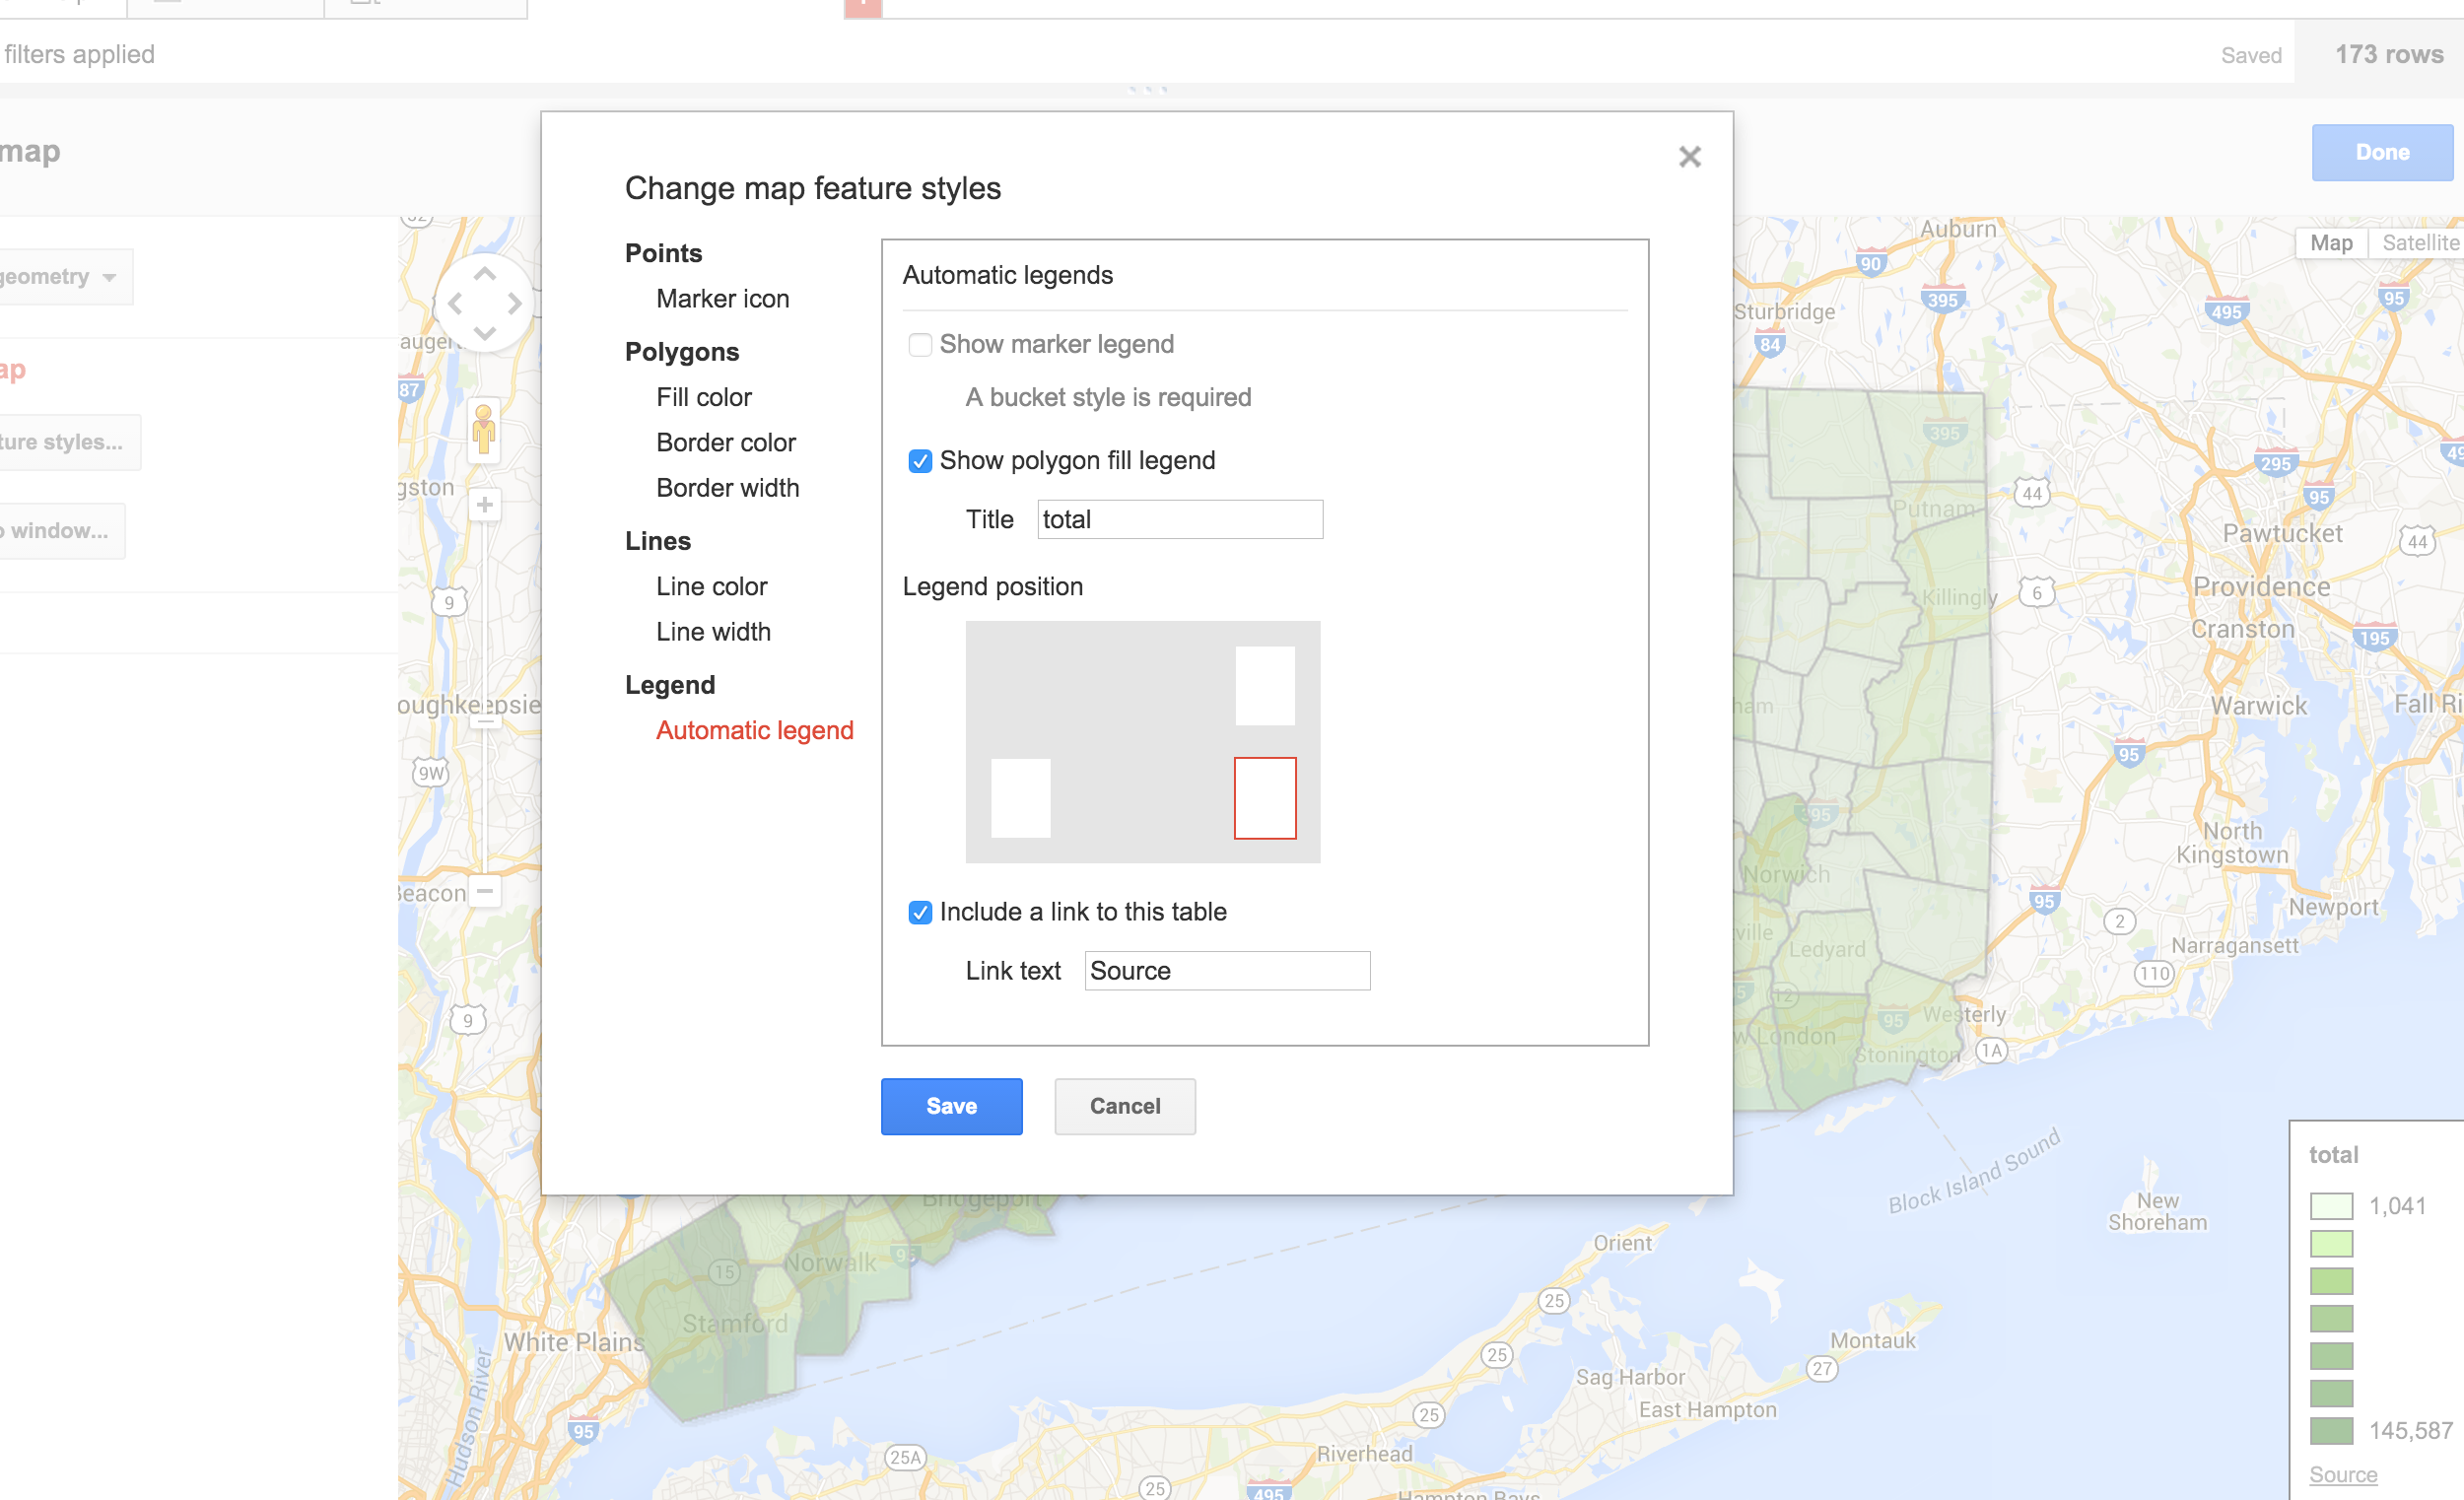
Click on Change feature styles on the left.
Then click on Fill color under Polygons.
Next, click the Gradient tab.
Click use this range so it specifically looks at the numbers in the column, not just up to 100. Click on the + sign to add more colors.
After there's maybe a total of 7 colors, click Save.
That's better.
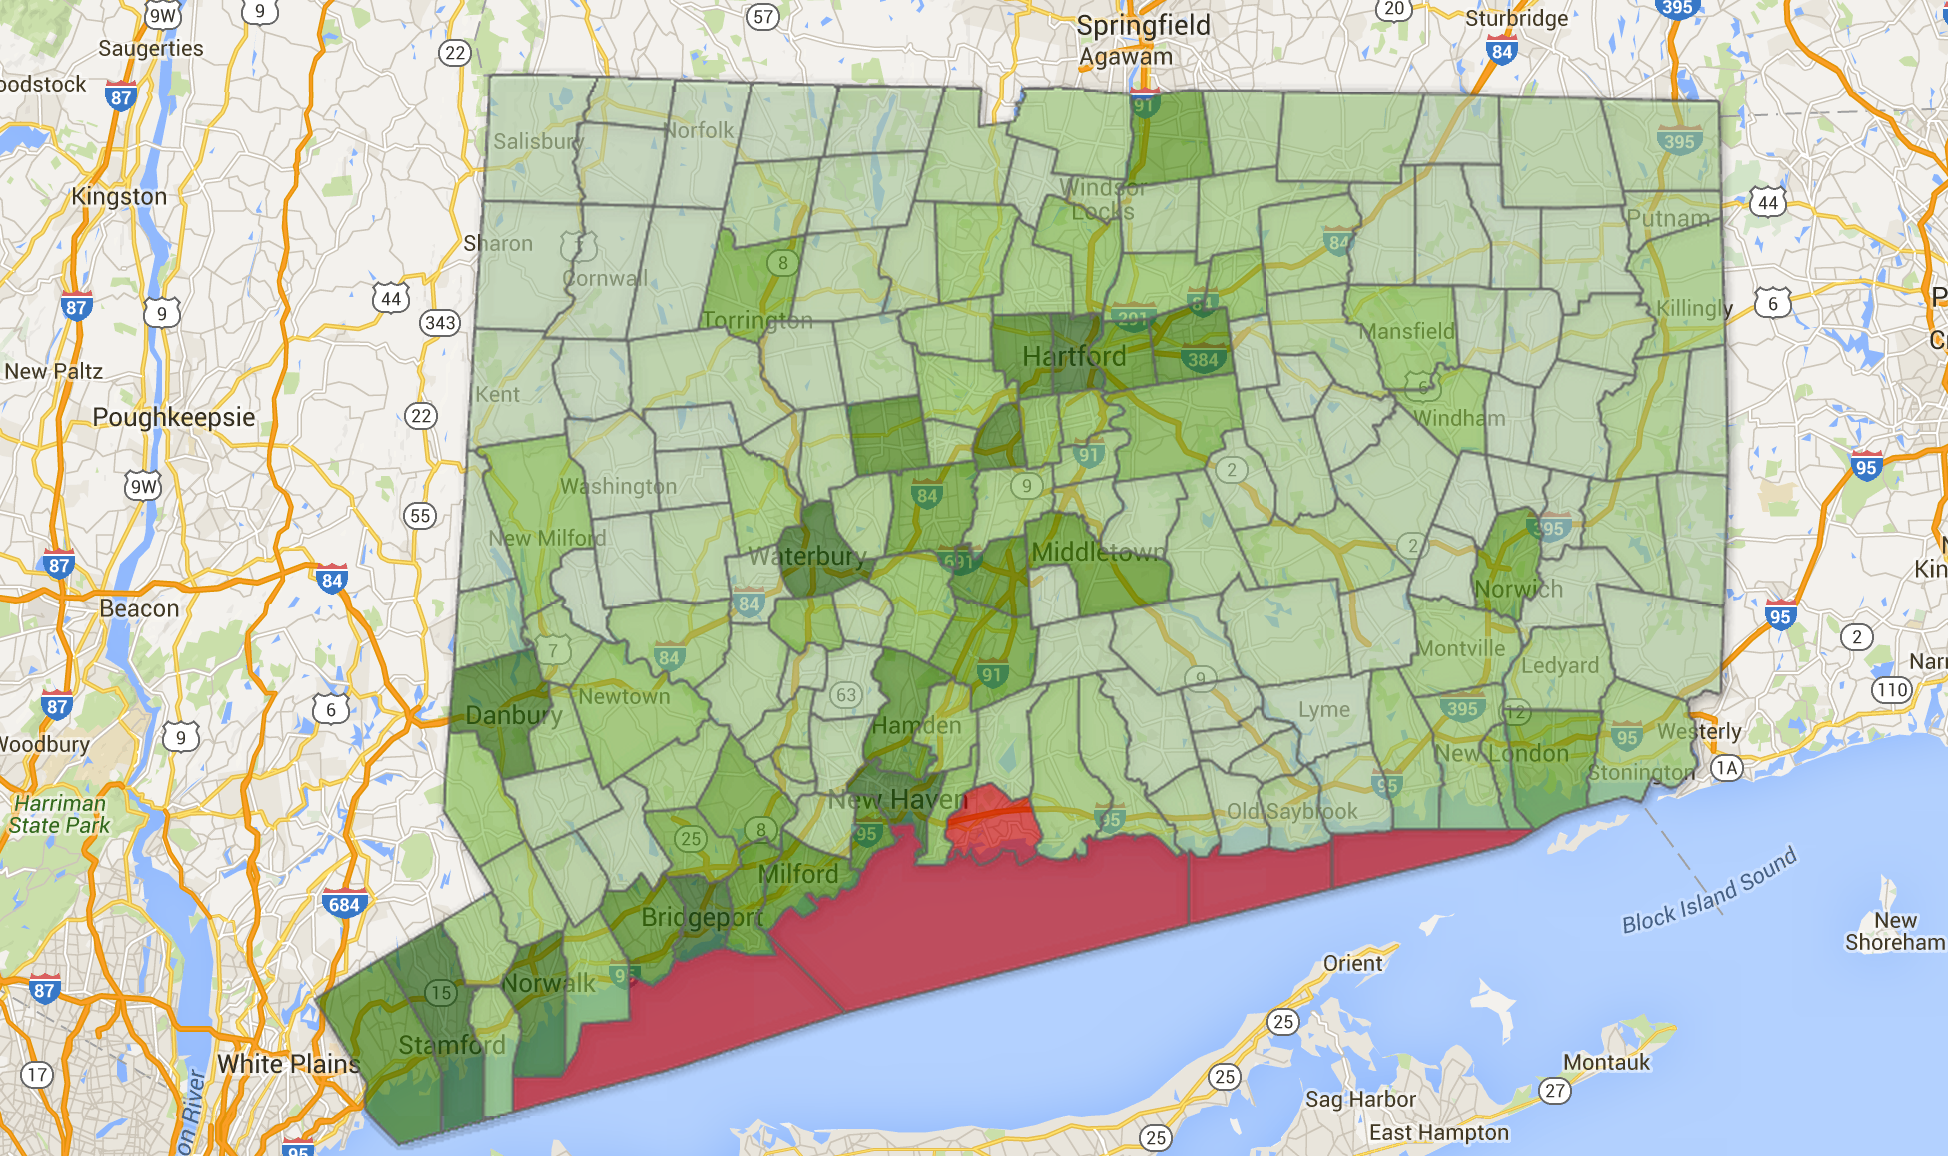
But there's some red, right? For boundaries that have no values.
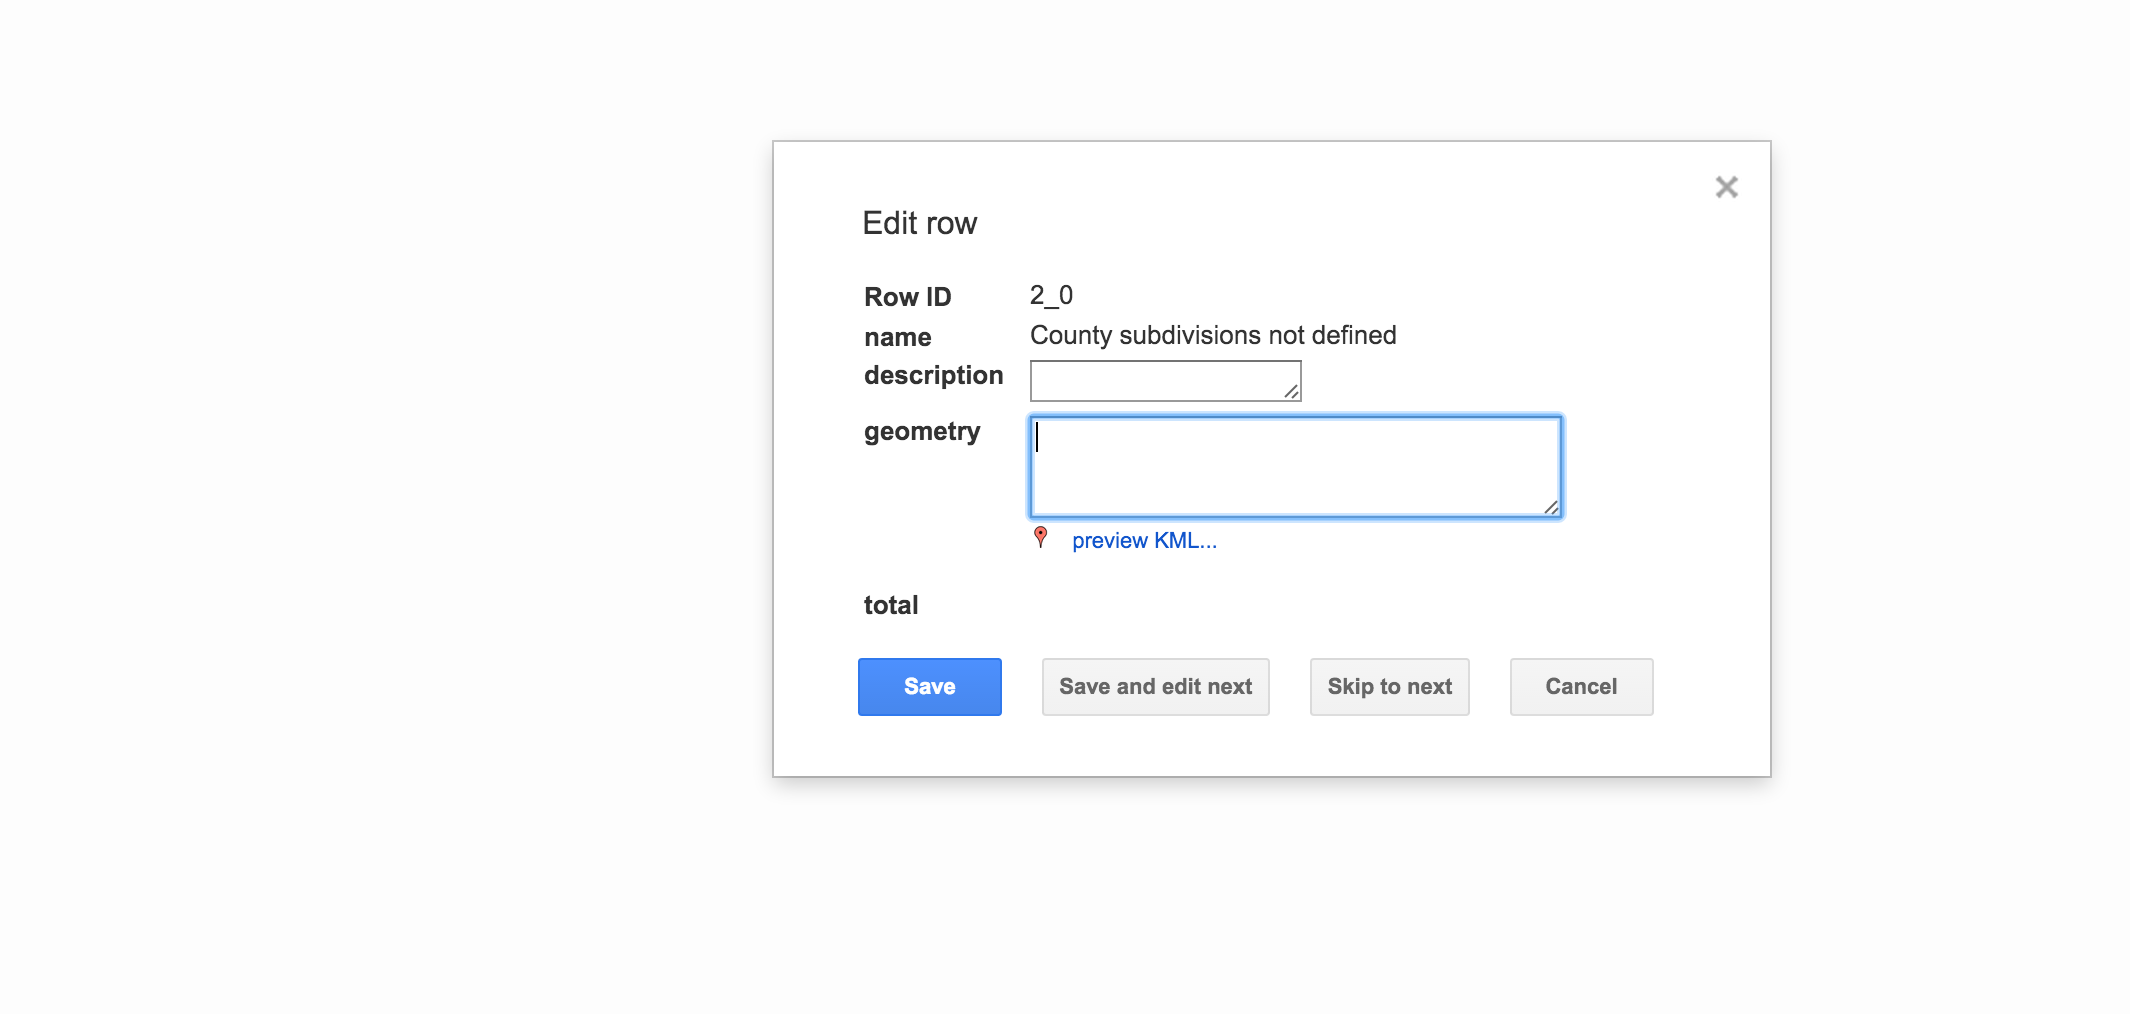
Click over to rows, and find the towns called County subdivisions not defined.
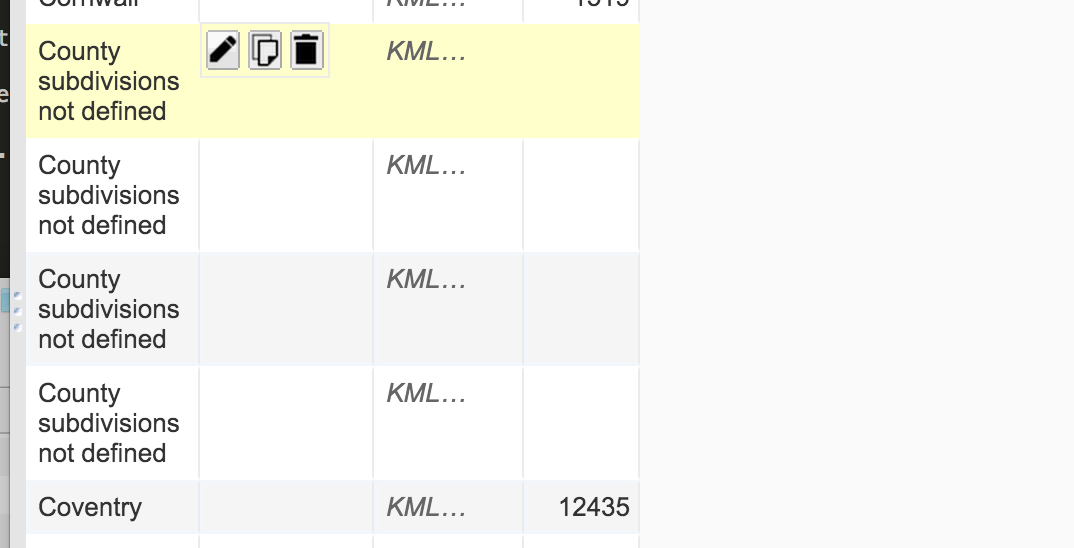
Double click into the geometry cell for each one and delete everything in geometry.
Click Save.
Do it for all four of them.
Go back to the map.

Nooo... there's still one bad one!
Branford!
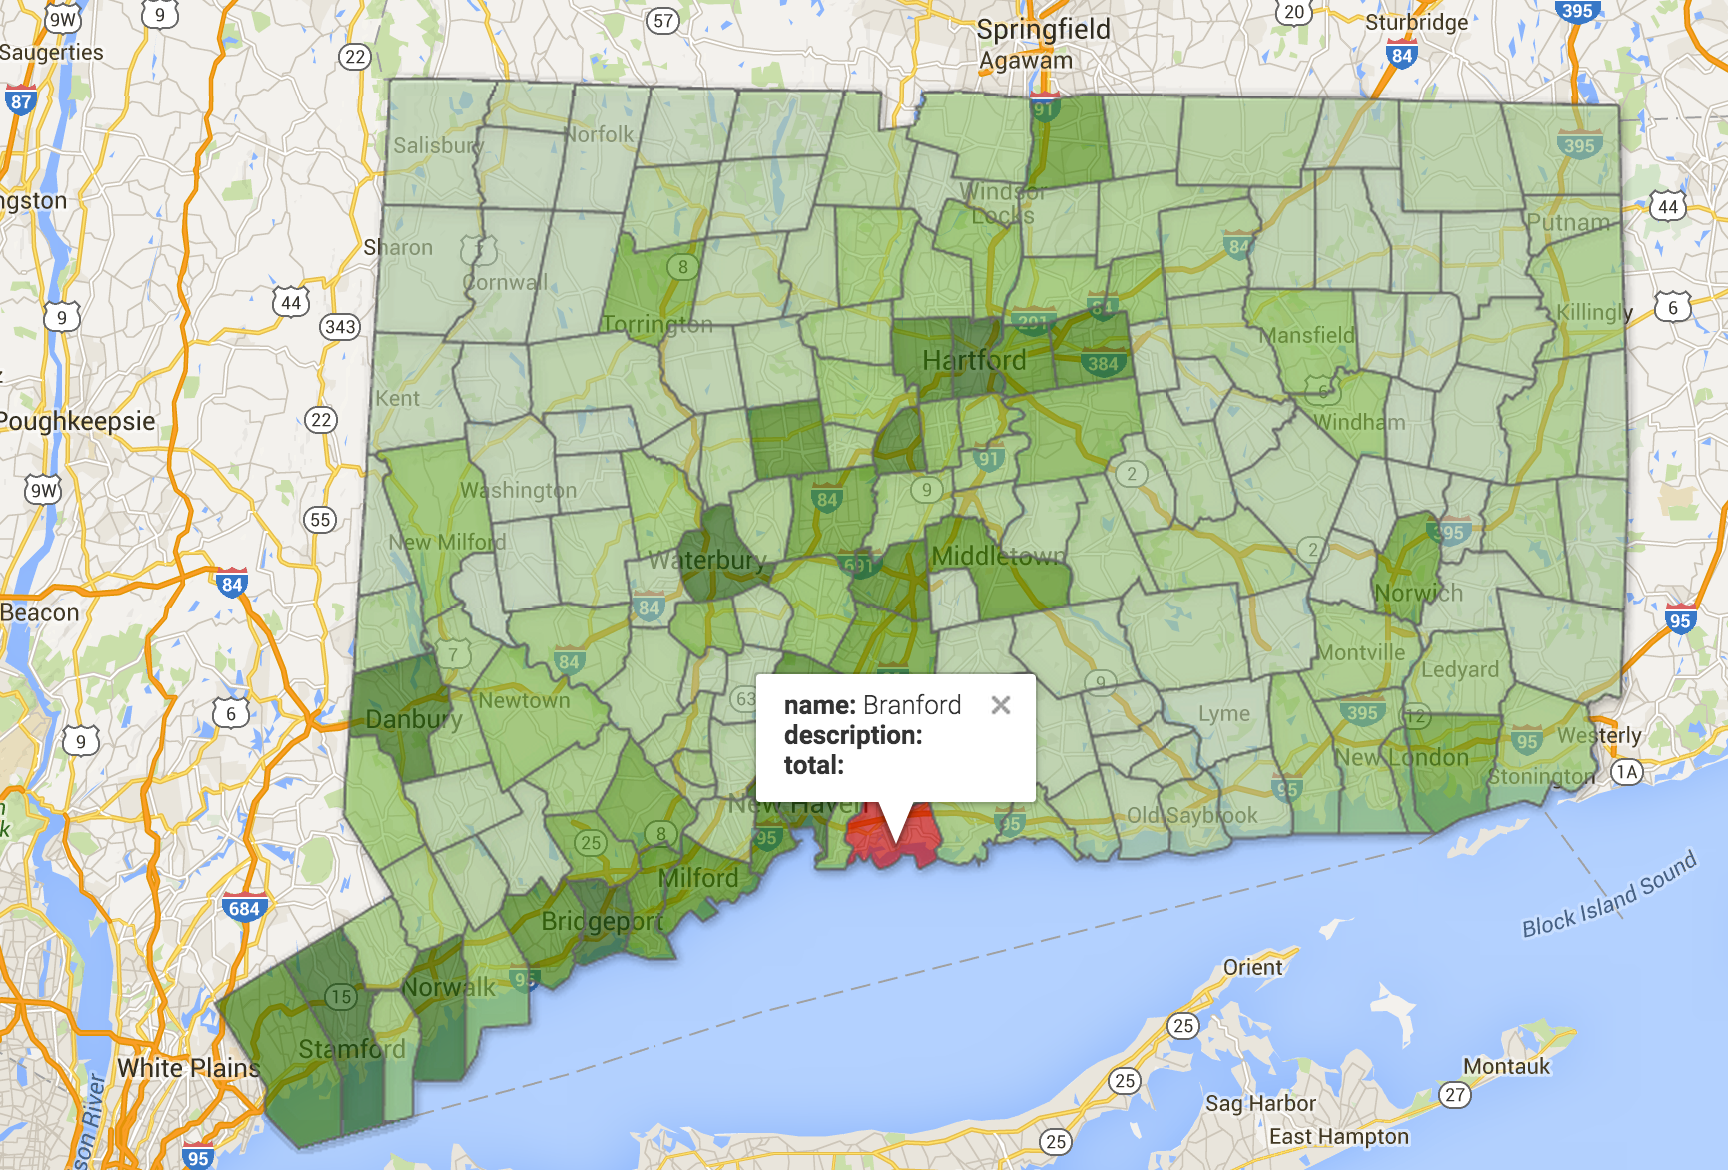
Why is that?
Well, look at the original data... Branford is mispelled.
That's why it didn't join correctly.
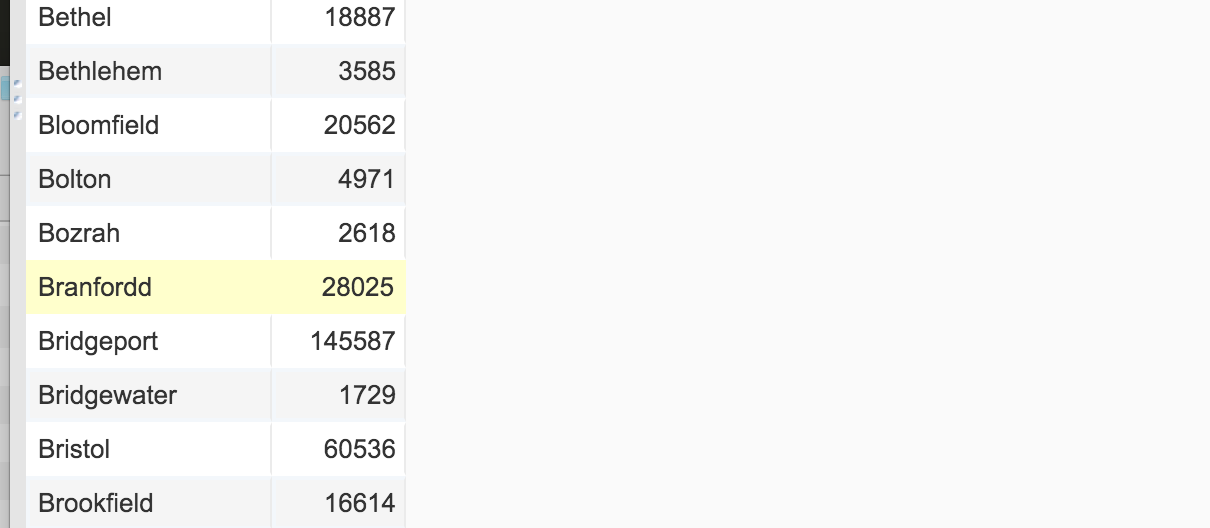
ok, fix it, bring it back in again.
Fun with icons [link]
Here's how to play around with layers. [link]