Some advanced data work in Open Refine
This is a continuation of the Cleaning up data with Open Refine tutorial.
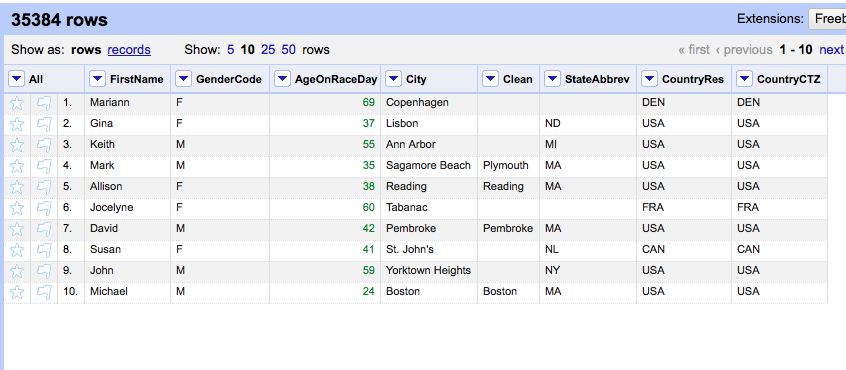
We have a dataset of all the runners registered in the Boston Marathon. We want to turn the data into a map.
We could do this in a pivot table, but I wanted to show you a way to do it in Open Refine that uses formulas.
Counting up values in columns with OpenRefine
Back to the dataset. Eliminate any facets you've previously created.
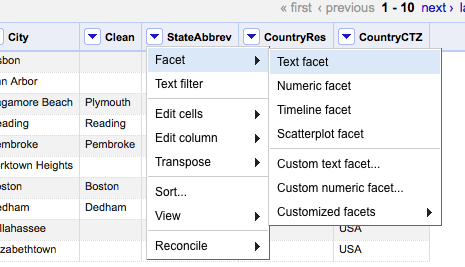
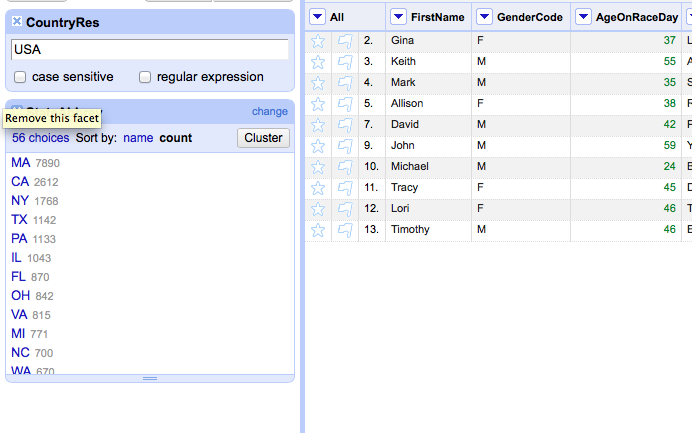
Let's make a quick Text Facet of all the StateAbbrev.
Now we've got a column for reference. We want this count list but we want it in a column format. We could just make a spreadsheet by hand, but that will take way too long.
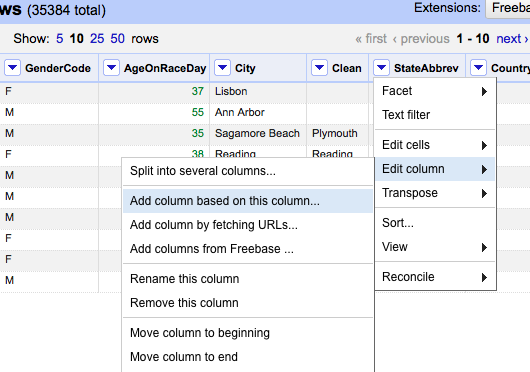
Click arrow > Edit column > Add column based on this column.
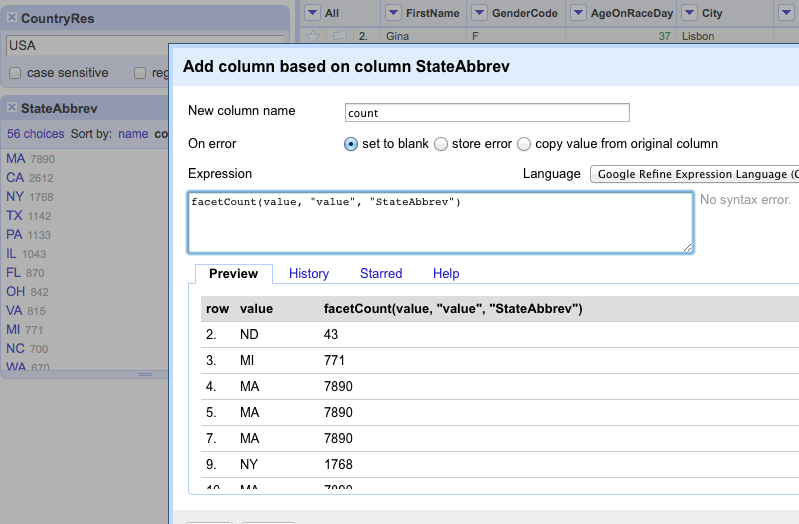
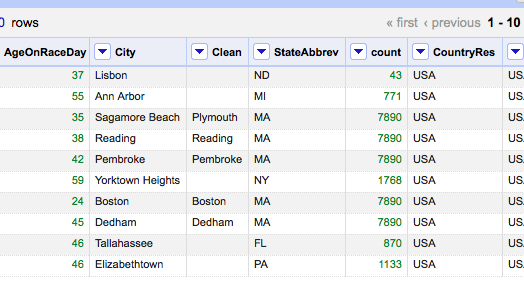
Type in facetCount(value, "value", "StateAbbrev") and then OK.
Eliminating duplicate rows
For this map's purpose, we don't need any individual data. We just want StateAbbrev and count.
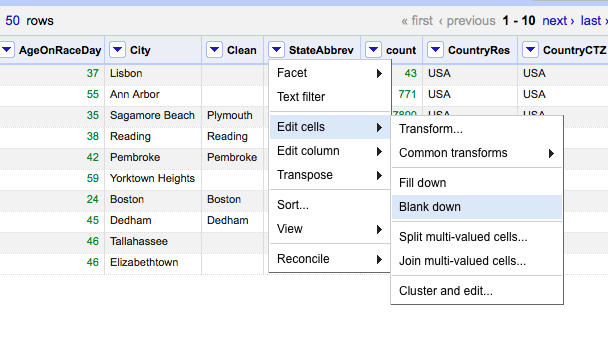
Click StateAbbrev arrow > Edit cells > Blank down.

Click State Abbrev arrow > Facet > Customized facets > Facet by blank.
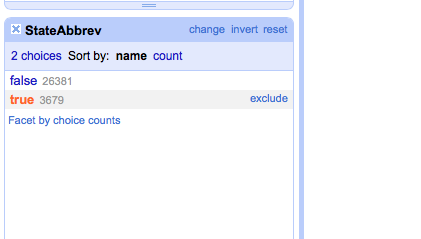
Click true.
Click State Abbrev arrow > Facet > Customized facets > Facet by blank.
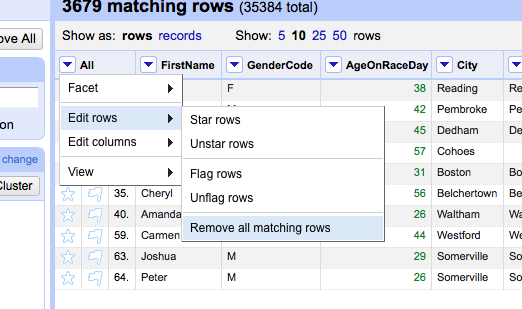
Click All arrow Edit rows > Remove all matching rows.
Merging columns with a different data set in Open Refine
Download this spreadsheet of U.S. States. [link]
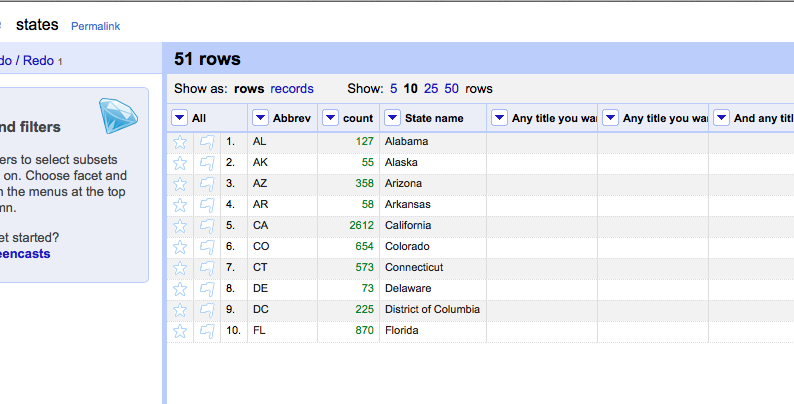
Open a new tab of OpenRefine and create a project using the States spreadsheet you just downloaded.
Call the project states.
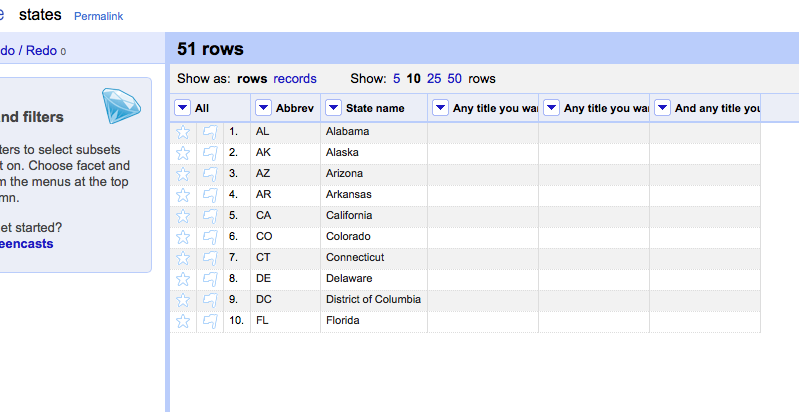
Simple. This is the format that will be recognized by the map generator.
We need to bring the counts for each state over.
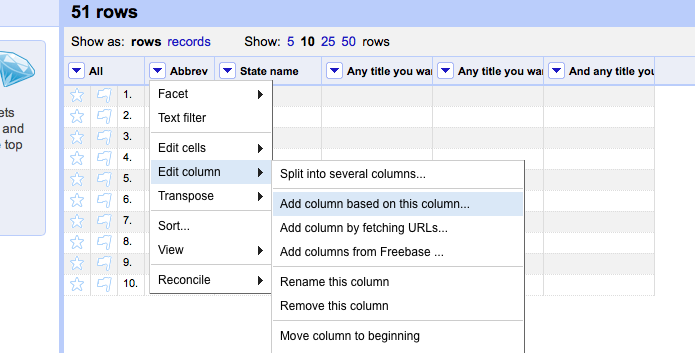
Click Abbrev arrow Edit column > Add column based on this column.
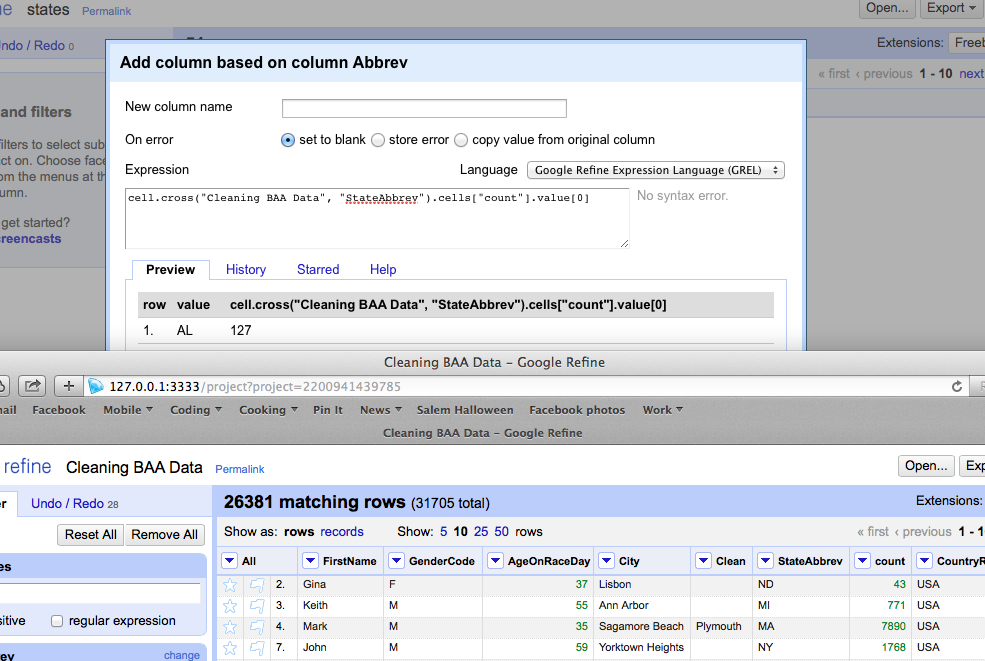
Type cell.cross("Cleaning BAA Data", "StateAbbrev").cells["count"].value[0] and click OK
It worked! Except that the column is in the wrong position.
Click count arrow > Edit column > Move column right
Brilliant!
Click Export> Excel (or CSV, up to you).
Now we can turn this into a choropleth map